Immigrants from North America vs Immigrants from Russia Child Poverty Among Girls Under 16
COMPARE
Immigrants from North America
Immigrants from Russia
Child Poverty Among Girls Under 16
Child Poverty Among Girls Under 16 Comparison
Immigrants from North America
Immigrants from Russia
14.9%
CHILD POVERTY AMONG GIRLS UNDER 16
96.6/ 100
METRIC RATING
93rd/ 347
METRIC RANK
14.7%
CHILD POVERTY AMONG GIRLS UNDER 16
97.9/ 100
METRIC RATING
76th/ 347
METRIC RANK
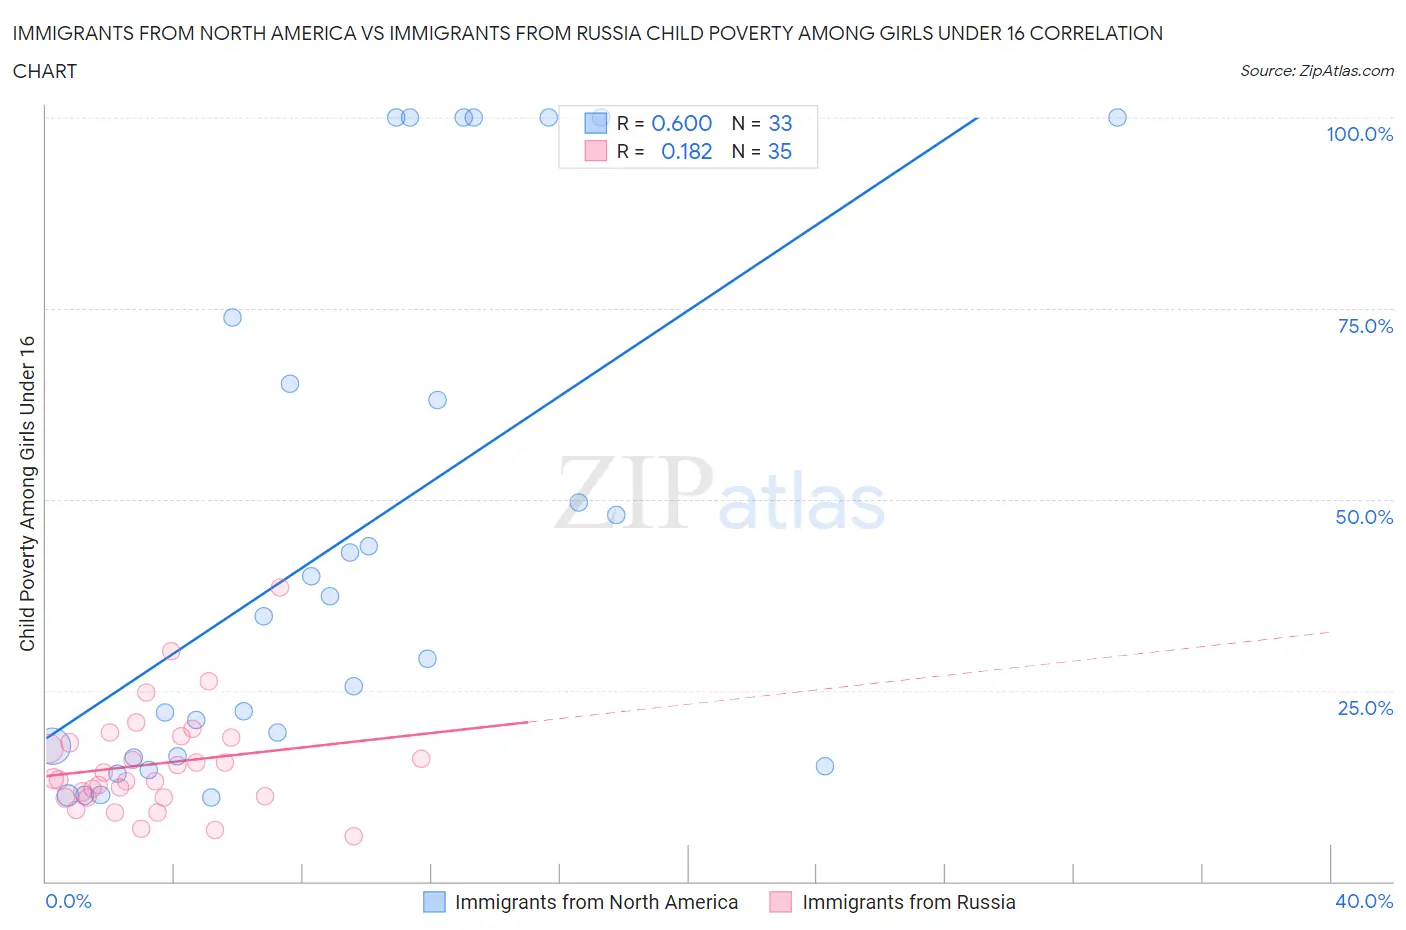
Immigrants from North America vs Immigrants from Russia Child Poverty Among Girls Under 16 Correlation Chart
The statistical analysis conducted on geographies consisting of 450,018,765 people shows a substantial positive correlation between the proportion of Immigrants from North America and poverty level among girls under the age of 16 in the United States with a correlation coefficient (R) of 0.600 and weighted average of 14.9%. Similarly, the statistical analysis conducted on geographies consisting of 341,568,734 people shows a poor positive correlation between the proportion of Immigrants from Russia and poverty level among girls under the age of 16 in the United States with a correlation coefficient (R) of 0.182 and weighted average of 14.7%, a difference of 1.6%.
Child Poverty Among Girls Under 16 Correlation Summary
| Measurement | Immigrants from North America | Immigrants from Russia |
| Minimum | 11.0% | 5.9% |
| Maximum | 100.0% | 38.5% |
| Range | 89.0% | 32.6% |
| Mean | 44.8% | 15.4% |
| Median | 34.8% | 13.4% |
| Interquartile 25% (IQ1) | 16.3% | 11.0% |
| Interquartile 75% (IQ3) | 69.5% | 18.9% |
| Interquartile Range (IQR) | 53.2% | 7.9% |
| Standard Deviation (Sample) | 33.4% | 6.8% |
| Standard Deviation (Population) | 32.8% | 6.7% |
Demographics Similar to Immigrants from North America and Immigrants from Russia by Child Poverty Among Girls Under 16
In terms of child poverty among girls under 16, the demographic groups most similar to Immigrants from North America are Austrian (14.9%, a difference of 0.070%), Immigrants from Switzerland (14.9%, a difference of 0.28%), Immigrants from Belarus (14.8%, a difference of 0.41%), Northern European (14.8%, a difference of 0.45%), and Jordanian (14.8%, a difference of 0.48%). Similarly, the demographic groups most similar to Immigrants from Russia are Tlingit-Haida (14.7%, a difference of 0.010%), Argentinean (14.7%, a difference of 0.020%), Immigrants from Turkey (14.7%, a difference of 0.030%), Egyptian (14.7%, a difference of 0.040%), and Immigrants from Eastern Europe (14.6%, a difference of 0.15%).
| Demographics | Rating | Rank | Child Poverty Among Girls Under 16 |
| Taiwanese | 98.0 /100 | #74 | Exceptional 14.6% |
| Immigrants | Eastern Europe | 98.0 /100 | #75 | Exceptional 14.6% |
| Immigrants | Russia | 97.9 /100 | #76 | Exceptional 14.7% |
| Tlingit-Haida | 97.9 /100 | #77 | Exceptional 14.7% |
| Argentineans | 97.9 /100 | #78 | Exceptional 14.7% |
| Immigrants | Turkey | 97.9 /100 | #79 | Exceptional 14.7% |
| Egyptians | 97.9 /100 | #80 | Exceptional 14.7% |
| Ukrainians | 97.7 /100 | #81 | Exceptional 14.7% |
| Macedonians | 97.6 /100 | #82 | Exceptional 14.7% |
| Immigrants | Italy | 97.4 /100 | #83 | Exceptional 14.8% |
| Soviet Union | 97.3 /100 | #84 | Exceptional 14.8% |
| Swiss | 97.2 /100 | #85 | Exceptional 14.8% |
| Australians | 97.2 /100 | #86 | Exceptional 14.8% |
| Finns | 97.2 /100 | #87 | Exceptional 14.8% |
| Immigrants | Canada | 97.1 /100 | #88 | Exceptional 14.8% |
| Jordanians | 97.1 /100 | #89 | Exceptional 14.8% |
| Northern Europeans | 97.0 /100 | #90 | Exceptional 14.8% |
| Immigrants | Belarus | 97.0 /100 | #91 | Exceptional 14.8% |
| Austrians | 96.7 /100 | #92 | Exceptional 14.9% |
| Immigrants | North America | 96.6 /100 | #93 | Exceptional 14.9% |
| Immigrants | Switzerland | 96.3 /100 | #94 | Exceptional 14.9% |