Immigrants from Norway vs Mexican American Indian Male Poverty

COMPARE

Immigrants from Norway
Race
Ancestry
AfghanAfricanAlaska NativeAlaskan AthabascanAlbanianAleutAlsatianAmericanApacheArabArapahoArgentineanArmenianAssyrian/Chaldean/SyriacAustralianAustrianBahamianBangladeshiBarbadianBasqueBelgianBelizeanBermudanBhutaneseBlackfeetBolivianBrazilianBritishBritish West IndianBulgarianBurmeseCajunCambodianCanadianCape VerdeanCarpatho RusynCelticCentral AmericanCentral American IndianCherokeeCheyenneChickasawChileanChineseChippewaChoctawColombianColvilleComancheCosta RicanCreeCreekCroatianCrowCubanCypriotCzechCzechoslovakianDanishDelawareDominicanDutchDutch West IndianEastern EuropeanEcuadorianEgyptianEnglishEstonianEthiopianEuropeanFijianFilipinoFinnishFrenchFrench American IndianFrench CanadianGermanGerman RussianGhanaianGreekGuamanian/ChamorroGuatemalanGuyaneseHaitianHmongHonduranHopiHoumaHungarianIcelanderIndian (Asian)IndonesianInupiatIranianIraqiIrishIroquoisIsraeliItalianJamaicanJapaneseJordanianKenyanKiowaKoreanLaotianLatvianLebaneseLiberianLithuanianLumbeeLuxembourgerMacedonianMalaysianMalteseMarshalleseMenomineeMexicanMongolianMoroccanNative HawaiianNavajoNepaleseNew ZealanderNicaraguanNigerianNorthern EuropeanNorwegianOkinawanOsageOttawaPaiutePakistaniPalestinianPanamanianParaguayanPennsylvania GermanPeruvianPimaPolishPortuguesePotawatomiPuebloPuerto RicanPuget Sound SalishRomanianRussianSalvadoranSamoanScandinavianScotch-IrishScottishSeminoleSenegaleseSerbianShoshoneSierra LeoneanSiouxSlavicSlovakSloveneSomaliSouth AfricanSouth AmericanSouth American IndianSoviet UnionSpaniardSpanishSpanish AmericanSpanish American IndianSri LankanSubsaharan AfricanSudaneseSwedishSwissSyrianTaiwaneseThaiTlingit-HaidaTohono O'OdhamTonganTrinidadian and TobagonianTsimshianTurkishU.S. Virgin IslanderUgandanUkrainianUruguayanUteVenezuelanVietnameseWelshWest IndianYakamaYaquiYugoslavianYumanYup'ikZimbabwean
Immigration
NonimmigrantsImmigrantsAfghanistanAfricaAlbaniaArgentinaArmeniaAsiaAustraliaAustriaBahamasBangladeshBarbadosBelarusBelgiumBelizeBoliviaBosnia and HerzegovinaBrazilBulgariaBurma/MyanmarCabo VerdeCambodiaCameroonCanadaCaribbeanCentral AmericaChileChinaColombiaCongoCosta RicaCroatiaCubaCzechoslovakiaDenmarkDominicaDominican RepublicEastern AfricaEastern AsiaEastern EuropeEcuadorEgyptEl SalvadorEnglandEritreaEthiopiaEuropeFijiFranceGermanyGhanaGreeceGrenadaGuatemalaGuyanaHaitiHondurasHong KongHungaryIndiaIndonesiaIranIraqIrelandIsraelItalyJamaicaJapanJordanKazakhstanKenyaKoreaKuwaitLaosLatin AmericaLatviaLebanonLiberiaLithuaniaMalaysiaMexicoMicronesiaMiddle AfricaMoldovaMoroccoNepalNetherlandsNicaraguaNigeriaNorth AmericaNorth MacedoniaNorthern AfricaNorthern EuropeNorwayOceaniaPakistanPanamaPeruPhilippinesPolandPortugalRomaniaRussiaSaudi ArabiaScotlandSenegalSerbiaSierra LeoneSingaporeSomaliaSouth AfricaSouth AmericaSouth Central AsiaSouth Eastern AsiaSouthern EuropeSpainSri LankaSt. Vincent and the GrenadinesSudanSwedenSwitzerlandSyriaTaiwanThailandTrinidad and TobagoTurkeyUgandaUkraineUruguayUzbekistanVenezuelaVietnamWest IndiesWestern AfricaWestern AsiaWestern EuropeYemenZaireZimbabweAzores
Mexican American Indian
Race
Ancestry
AfghanAfricanAlaska NativeAlaskan AthabascanAlbanianAleutAlsatianAmericanApacheArabArapahoArgentineanArmenianAssyrian/Chaldean/SyriacAustralianAustrianBahamianBangladeshiBarbadianBasqueBelgianBelizeanBermudanBhutaneseBlackfeetBolivianBrazilianBritishBritish West IndianBulgarianBurmeseCajunCambodianCanadianCape VerdeanCarpatho RusynCelticCentral AmericanCentral American IndianCherokeeCheyenneChickasawChileanChineseChippewaChoctawColombianColvilleComancheCosta RicanCreeCreekCroatianCrowCubanCypriotCzechCzechoslovakianDanishDelawareDominicanDutchDutch West IndianEastern EuropeanEcuadorianEgyptianEnglishEstonianEthiopianEuropeanFijianFilipinoFinnishFrenchFrench American IndianFrench CanadianGermanGerman RussianGhanaianGreekGuamanian/ChamorroGuatemalanGuyaneseHaitianHmongHonduranHopiHoumaHungarianIcelanderIndian (Asian)IndonesianInupiatIranianIraqiIrishIroquoisIsraeliItalianJamaicanJapaneseJordanianKenyanKiowaKoreanLaotianLatvianLebaneseLiberianLithuanianLumbeeLuxembourgerMacedonianMalaysianMalteseMarshalleseMenomineeMexicanMexican American IndianMongolianMoroccanNative HawaiianNavajoNepaleseNew ZealanderNicaraguanNigerianNorthern EuropeanNorwegianOkinawanOsageOttawaPaiutePakistaniPalestinianPanamanianParaguayanPennsylvania GermanPeruvianPimaPolishPortuguesePotawatomiPuebloPuerto RicanPuget Sound SalishRomanianRussianSalvadoranSamoanScandinavianScotch-IrishScottishSeminoleSenegaleseSerbianShoshoneSierra LeoneanSiouxSlavicSlovakSloveneSomaliSouth AfricanSouth AmericanSouth American IndianSoviet UnionSpaniardSpanishSpanish AmericanSpanish American IndianSri LankanSubsaharan AfricanSudaneseSwedishSwissSyrianTaiwaneseThaiTlingit-HaidaTohono O'OdhamTonganTrinidadian and TobagonianTsimshianTurkishU.S. Virgin IslanderUgandanUkrainianUruguayanUteVenezuelanVietnameseWelshWest IndianYakamaYaquiYugoslavianYumanYup'ikZimbabwean
Immigration
NonimmigrantsImmigrantsAfghanistanAfricaAlbaniaArgentinaArmeniaAsiaAustraliaAustriaBahamasBangladeshBarbadosBelarusBelgiumBelizeBoliviaBosnia and HerzegovinaBrazilBulgariaBurma/MyanmarCabo VerdeCambodiaCameroonCanadaCaribbeanCentral AmericaChileChinaColombiaCongoCosta RicaCroatiaCubaCzechoslovakiaDenmarkDominicaDominican RepublicEastern AfricaEastern AsiaEastern EuropeEcuadorEgyptEl SalvadorEnglandEritreaEthiopiaEuropeFijiFranceGermanyGhanaGreeceGrenadaGuatemalaGuyanaHaitiHondurasHong KongHungaryIndiaIndonesiaIranIraqIrelandIsraelItalyJamaicaJapanJordanKazakhstanKenyaKoreaKuwaitLaosLatin AmericaLatviaLebanonLiberiaLithuaniaMalaysiaMexicoMicronesiaMiddle AfricaMoldovaMoroccoNepalNetherlandsNicaraguaNigeriaNorth AmericaNorth MacedoniaNorthern AfricaNorthern EuropeOceaniaPakistanPanamaPeruPhilippinesPolandPortugalRomaniaRussiaSaudi ArabiaScotlandSenegalSerbiaSierra LeoneSingaporeSomaliaSouth AfricaSouth AmericaSouth Central AsiaSouth Eastern AsiaSouthern EuropeSpainSri LankaSt. Vincent and the GrenadinesSudanSwedenSwitzerlandSyriaTaiwanThailandTrinidad and TobagoTurkeyUgandaUkraineUruguayUzbekistanVenezuelaVietnamWest IndiesWestern AfricaWestern AsiaWestern EuropeYemenZaireZimbabweAzores
Male Poverty
Income
Poverty
Unemployment
Labor Participation
Family Structure
Vehicle Availability
Education Level
Disability

Male Poverty Comparison

Immigrants from Norway

Mexican American Indians

Excellent
Tragic
10.7%
MALE POVERTY
86.0/ 100
METRIC RATING
125th/ 347
METRIC RANK
13.0%
MALE POVERTY
0.1/ 100
METRIC RATING
254th/ 347
METRIC RANK

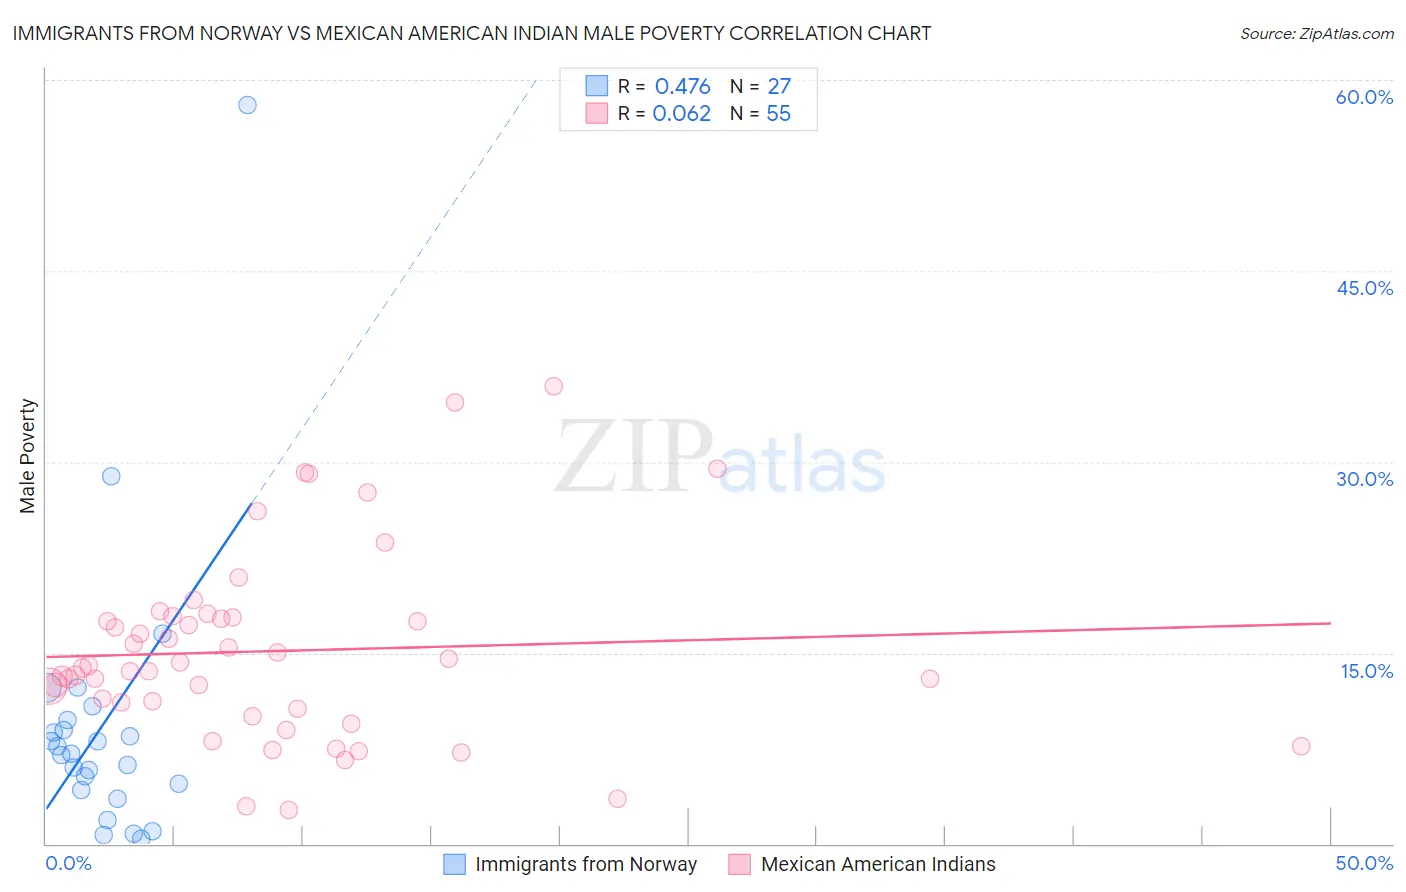
Immigrants from Norway vs Mexican American Indian Male Poverty Correlation Chart

The statistical analysis conducted on geographies consisting of 116,684,379 people shows a moderate positive correlation between the proportion of Immigrants from Norway and poverty level among males in the United States with a correlation coefficient (R) of 0.476 and weighted average of 10.7%. Similarly, the statistical analysis conducted on geographies consisting of 317,482,192 people shows a slight positive correlation between the proportion of Mexican American Indians and poverty level among males in the United States with a correlation coefficient (R) of 0.062 and weighted average of 13.0%, a difference of 21.4%.
Immigrants from Norway vs Mexican American Indian Male Poverty

Male Poverty Correlation Summary

MeasurementImmigrants from NorwayMexican American Indian
Minimum0.44%2.6%
Maximum58.1%35.9%
Range57.6%33.3%
Mean9.4%15.1%
Median7.1%13.8%
Interquartile 25% (IQ1)4.2%10.6%
Interquartile 75% (IQ3)9.7%17.8%
Interquartile Range (IQR)5.6%7.2%
Standard Deviation (Sample)11.3%7.4%
Standard Deviation (Population)11.1%7.3%

Similar Demographics by Male Poverty

Demographics Similar to Immigrants from Norway by Male Poverty

In terms of male poverty, the demographic groups most similar to Immigrants from Norway are French (10.7%, a difference of 0.15%), South African (10.7%, a difference of 0.18%), Native Hawaiian (10.7%, a difference of 0.22%), Peruvian (10.7%, a difference of 0.23%), and Immigrants from China (10.7%, a difference of 0.25%).
DemographicsRating | RankMale Poverty
Okinawans
87.6
/100
|
#118
Excellent
10.7%
Immigrants | Hungary
87.6
/100
|
#119
Excellent
10.7%
Immigrants | China
87.1
/100
|
#120
Excellent
10.7%
Peruvians
87.1
/100
|
#121
Excellent
10.7%
Native Hawaiians
87.0
/100
|
#122
Excellent
10.7%
South Africans
86.8
/100
|
#123
Excellent
10.7%
French
86.7
/100
|
#124
Excellent
10.7%
Immigrants | Norway
86.0
/100
|
#125
Excellent
10.7%
Immigrants | Ukraine
84.3
/100
|
#126
Excellent
10.7%
Puget Sound Salish
84.3
/100
|
#127
Excellent
10.7%
Immigrants | Western Europe
84.2
/100
|
#128
Excellent
10.7%
Immigrants | Peru
84.1
/100
|
#129
Excellent
10.7%
Chileans
83.9
/100
|
#130
Excellent
10.7%
Immigrants | Belarus
83.3
/100
|
#131
Excellent
10.7%
Immigrants | Vietnam
83.0
/100
|
#132
Excellent
10.8%

Demographics Similar to Mexican American Indians by Male Poverty

In terms of male poverty, the demographic groups most similar to Mexican American Indians are Immigrants from Liberia (13.0%, a difference of 0.090%), Immigrants from Burma/Myanmar (13.0%, a difference of 0.29%), Immigrants from Ghana (12.9%, a difference of 0.39%), Immigrants from Ecuador (12.9%, a difference of 0.44%), and Immigrants from Cuba (12.9%, a difference of 0.47%).
DemographicsRating | RankMale Poverty
Immigrants | Western Africa
0.2
/100
|
#247
Tragic
12.9%
Immigrants | Sudan
0.2
/100
|
#248
Tragic
12.9%
Potawatomi
0.2
/100
|
#249
Tragic
12.9%
Immigrants | Nicaragua
0.2
/100
|
#250
Tragic
12.9%
Immigrants | Cuba
0.2
/100
|
#251
Tragic
12.9%
Immigrants | Ecuador
0.2
/100
|
#252
Tragic
12.9%
Immigrants | Ghana
0.2
/100
|
#253
Tragic
12.9%
Mexican American Indians
0.1
/100
|
#254
Tragic
13.0%
Immigrants | Liberia
0.1
/100
|
#255
Tragic
13.0%
Immigrants | Burma/Myanmar
0.1
/100
|
#256
Tragic
13.0%
Immigrants | Trinidad and Tobago
0.1
/100
|
#257
Tragic
13.1%
Cape Verdeans
0.1
/100
|
#258
Tragic
13.1%
Cherokee
0.1
/100
|
#259
Tragic
13.1%
Ottawa
0.1
/100
|
#260
Tragic
13.1%
Trinidadians and Tobagonians
0.1
/100
|
#261
Tragic
13.1%