Immigrants from Norway vs Immigrants from Venezuela Single Mother Poverty
COMPARE
Immigrants from Norway
Immigrants from Venezuela
Single Mother Poverty
Single Mother Poverty Comparison
Immigrants from Norway
Immigrants from Venezuela
29.3%
SINGLE MOTHER POVERTY
41.5/ 100
METRIC RATING
180th/ 347
METRIC RANK
28.1%
SINGLE MOTHER POVERTY
95.8/ 100
METRIC RATING
107th/ 347
METRIC RANK
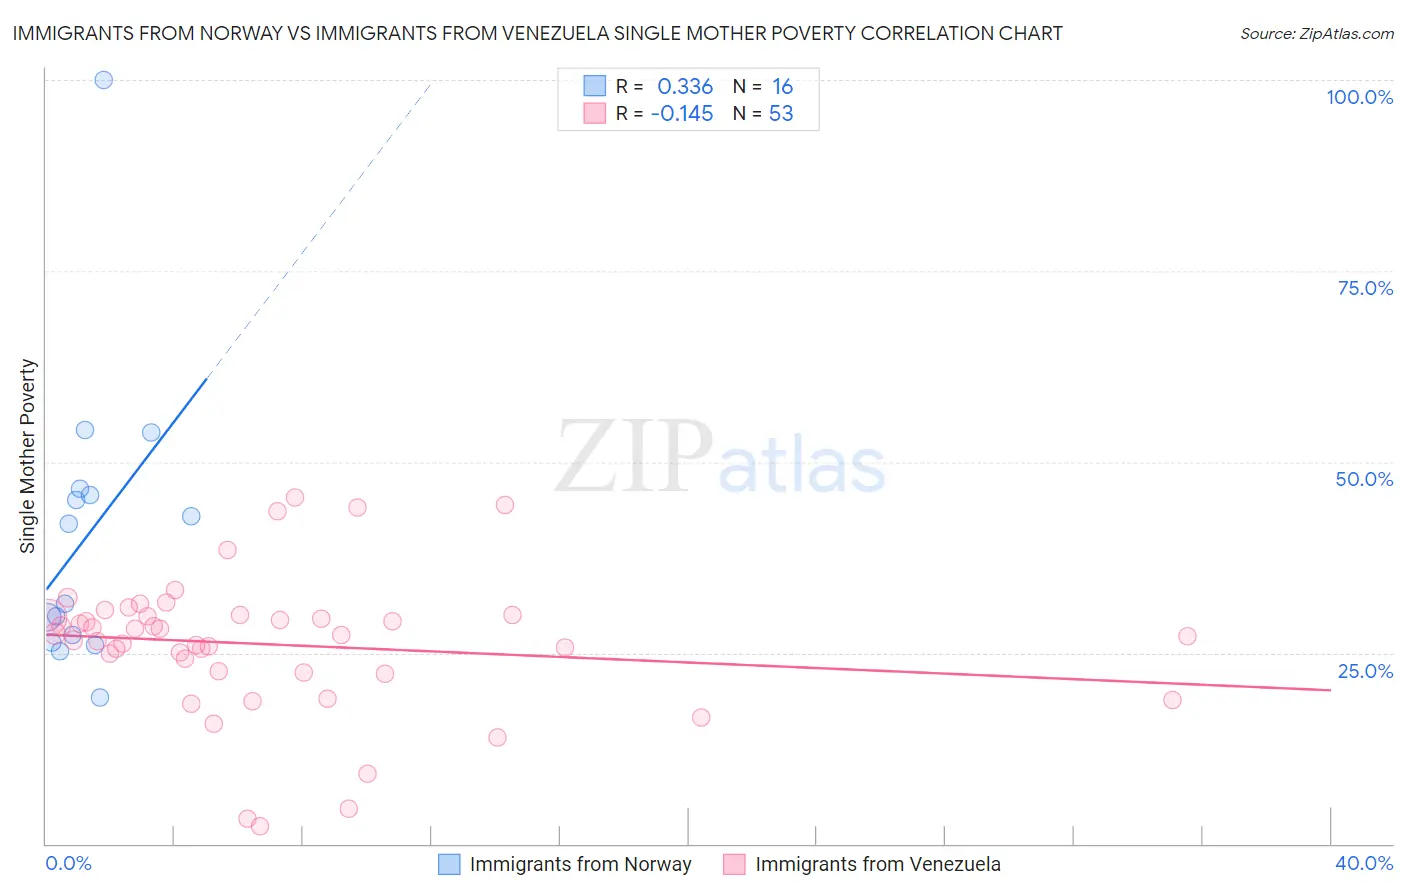
Immigrants from Norway vs Immigrants from Venezuela Single Mother Poverty Correlation Chart
The statistical analysis conducted on geographies consisting of 115,092,728 people shows a mild positive correlation between the proportion of Immigrants from Norway and poverty level among single mothers in the United States with a correlation coefficient (R) of 0.336 and weighted average of 29.3%. Similarly, the statistical analysis conducted on geographies consisting of 283,418,306 people shows a poor negative correlation between the proportion of Immigrants from Venezuela and poverty level among single mothers in the United States with a correlation coefficient (R) of -0.145 and weighted average of 28.1%, a difference of 4.3%.
Single Mother Poverty Correlation Summary
| Measurement | Immigrants from Norway | Immigrants from Venezuela |
| Minimum | 19.1% | 2.4% |
| Maximum | 100.0% | 45.4% |
| Range | 80.9% | 43.0% |
| Mean | 40.3% | 26.1% |
| Median | 36.6% | 27.3% |
| Interquartile 25% (IQ1) | 26.8% | 22.5% |
| Interquartile 75% (IQ3) | 46.1% | 29.9% |
| Interquartile Range (IQR) | 19.3% | 7.4% |
| Standard Deviation (Sample) | 19.3% | 9.0% |
| Standard Deviation (Population) | 18.7% | 9.0% |
Similar Demographics by Single Mother Poverty
Demographics Similar to Immigrants from Norway by Single Mother Poverty
In terms of single mother poverty, the demographic groups most similar to Immigrants from Norway are Immigrants from Uzbekistan (29.3%, a difference of 0.050%), Canadian (29.3%, a difference of 0.060%), South American Indian (29.3%, a difference of 0.090%), Immigrants from Eastern Africa (29.3%, a difference of 0.15%), and Nepalese (29.3%, a difference of 0.16%).
| Demographics | Rating | Rank | Single Mother Poverty |
| British | 50.6 /100 | #173 | Average 29.2% |
| Immigrants | Saudi Arabia | 50.0 /100 | #174 | Average 29.2% |
| Immigrants | Costa Rica | 48.8 /100 | #175 | Average 29.2% |
| Hawaiians | 47.8 /100 | #176 | Average 29.2% |
| Immigrants | Bosnia and Herzegovina | 45.1 /100 | #177 | Average 29.2% |
| South American Indians | 43.2 /100 | #178 | Average 29.3% |
| Immigrants | Uzbekistan | 42.6 /100 | #179 | Average 29.3% |
| Immigrants | Norway | 41.5 /100 | #180 | Average 29.3% |
| Canadians | 40.4 /100 | #181 | Average 29.3% |
| Immigrants | Eastern Africa | 38.5 /100 | #182 | Fair 29.3% |
| Nepalese | 38.3 /100 | #183 | Fair 29.3% |
| Nigerians | 38.0 /100 | #184 | Fair 29.3% |
| Ghanaians | 36.8 /100 | #185 | Fair 29.4% |
| Yugoslavians | 36.0 /100 | #186 | Fair 29.4% |
| Lebanese | 32.5 /100 | #187 | Fair 29.4% |
Demographics Similar to Immigrants from Venezuela by Single Mother Poverty
In terms of single mother poverty, the demographic groups most similar to Immigrants from Venezuela are Immigrants from Zimbabwe (28.1%, a difference of 0.080%), Immigrants from Armenia (28.1%, a difference of 0.17%), Ukrainian (28.0%, a difference of 0.21%), Israeli (28.0%, a difference of 0.25%), and Italian (28.0%, a difference of 0.28%).
| Demographics | Rating | Rank | Single Mother Poverty |
| Zimbabweans | 97.1 /100 | #100 | Exceptional 27.9% |
| Pakistanis | 96.9 /100 | #101 | Exceptional 28.0% |
| Immigrants | Croatia | 96.7 /100 | #102 | Exceptional 28.0% |
| Immigrants | Northern Africa | 96.6 /100 | #103 | Exceptional 28.0% |
| Italians | 96.6 /100 | #104 | Exceptional 28.0% |
| Israelis | 96.5 /100 | #105 | Exceptional 28.0% |
| Ukrainians | 96.4 /100 | #106 | Exceptional 28.0% |
| Immigrants | Venezuela | 95.8 /100 | #107 | Exceptional 28.1% |
| Immigrants | Zimbabwe | 95.5 /100 | #108 | Exceptional 28.1% |
| Immigrants | Armenia | 95.2 /100 | #109 | Exceptional 28.1% |
| Croatians | 94.8 /100 | #110 | Exceptional 28.2% |
| Venezuelans | 94.5 /100 | #111 | Exceptional 28.2% |
| Immigrants | Kazakhstan | 94.5 /100 | #112 | Exceptional 28.2% |
| Immigrants | South Africa | 93.2 /100 | #113 | Exceptional 28.3% |
| Immigrants | Western Asia | 92.7 /100 | #114 | Exceptional 28.3% |