Immigrants from North Macedonia vs Arab Single Female Poverty

COMPARE

Immigrants from North Macedonia
Race
Ancestry
AfghanAfricanAlaska NativeAlaskan AthabascanAlbanianAleutAlsatianAmericanApacheArapahoArgentineanArmenianAssyrian/Chaldean/SyriacAustralianAustrianBahamianBangladeshiBarbadianBasqueBelgianBelizeanBermudanBhutaneseBlackfeetBolivianBrazilianBritishBritish West IndianBulgarianBurmeseCajunCambodianCanadianCape VerdeanCarpatho RusynCelticCentral AmericanCentral American IndianCherokeeCheyenneChickasawChileanChineseChippewaChoctawColombianColvilleComancheCosta RicanCreeCreekCroatianCrowCubanCypriotCzechCzechoslovakianDanishDelawareDominicanDutchDutch West IndianEastern EuropeanEcuadorianEgyptianEnglishEstonianEthiopianEuropeanFijianFilipinoFinnishFrenchFrench American IndianFrench CanadianGermanGerman RussianGhanaianGreekGuamanian/ChamorroGuatemalanGuyaneseHaitianHmongHonduranHopiHoumaHungarianIcelanderIndian (Asian)IndonesianInupiatIranianIraqiIrishIroquoisIsraeliItalianJamaicanJapaneseJordanianKenyanKiowaKoreanLaotianLatvianLebaneseLiberianLithuanianLumbeeLuxembourgerMacedonianMalaysianMalteseMarshalleseMenomineeMexicanMexican American IndianMongolianMoroccanNative HawaiianNavajoNepaleseNew ZealanderNicaraguanNigerianNorthern EuropeanNorwegianOkinawanOsageOttawaPaiutePakistaniPalestinianPanamanianParaguayanPennsylvania GermanPeruvianPimaPolishPortuguesePotawatomiPuebloPuerto RicanPuget Sound SalishRomanianRussianSalvadoranSamoanScandinavianScotch-IrishScottishSeminoleSenegaleseSerbianShoshoneSierra LeoneanSiouxSlavicSlovakSloveneSomaliSouth AfricanSouth AmericanSouth American IndianSoviet UnionSpaniardSpanishSpanish AmericanSpanish American IndianSri LankanSubsaharan AfricanSudaneseSwedishSwissSyrianTaiwaneseThaiTlingit-HaidaTohono O'OdhamTonganTrinidadian and TobagonianTsimshianTurkishU.S. Virgin IslanderUgandanUkrainianUruguayanUteVenezuelanVietnameseWelshWest IndianYakamaYaquiYugoslavianYumanYup'ikZimbabwean
Immigration
NonimmigrantsImmigrantsAfghanistanAfricaAlbaniaArgentinaArmeniaAsiaAustraliaAustriaBahamasBangladeshBarbadosBelarusBelgiumBelizeBoliviaBosnia and HerzegovinaBrazilBulgariaBurma/MyanmarCabo VerdeCambodiaCameroonCanadaCaribbeanCentral AmericaChileChinaColombiaCongoCosta RicaCroatiaCubaCzechoslovakiaDenmarkDominicaDominican RepublicEastern AfricaEastern AsiaEastern EuropeEcuadorEgyptEl SalvadorEnglandEritreaEthiopiaEuropeFijiFranceGermanyGhanaGreeceGrenadaGuatemalaGuyanaHaitiHondurasHong KongHungaryIndiaIndonesiaIranIraqIrelandIsraelItalyJamaicaJapanJordanKazakhstanKenyaKoreaKuwaitLaosLatin AmericaLatviaLebanonLiberiaLithuaniaMalaysiaMexicoMicronesiaMiddle AfricaMoldovaMoroccoNepalNetherlandsNicaraguaNigeriaNorth AmericaNorth MacedoniaNorthern AfricaNorthern EuropeNorwayOceaniaPakistanPanamaPeruPhilippinesPolandPortugalRomaniaRussiaSaudi ArabiaScotlandSenegalSerbiaSierra LeoneSingaporeSomaliaSouth AfricaSouth AmericaSouth Central AsiaSouth Eastern AsiaSouthern EuropeSpainSri LankaSt. Vincent and the GrenadinesSudanSwedenSwitzerlandSyriaTaiwanThailandTrinidad and TobagoTurkeyUgandaUkraineUruguayUzbekistanVenezuelaVietnamWest IndiesWestern AfricaWestern AsiaWestern EuropeYemenZaireZimbabweAzores
Arab
Race
Ancestry
AfghanAfricanAlaska NativeAlaskan AthabascanAlbanianAleutAlsatianAmericanApacheArabArapahoArgentineanArmenianAssyrian/Chaldean/SyriacAustralianAustrianBahamianBangladeshiBarbadianBasqueBelgianBelizeanBermudanBhutaneseBlackfeetBolivianBrazilianBritishBritish West IndianBulgarianBurmeseCajunCambodianCanadianCape VerdeanCarpatho RusynCelticCentral AmericanCentral American IndianCherokeeCheyenneChickasawChileanChineseChippewaChoctawColombianColvilleComancheCosta RicanCreeCreekCroatianCrowCubanCypriotCzechCzechoslovakianDanishDelawareDominicanDutchDutch West IndianEastern EuropeanEcuadorianEgyptianEnglishEstonianEthiopianEuropeanFijianFilipinoFinnishFrenchFrench American IndianFrench CanadianGermanGerman RussianGhanaianGreekGuamanian/ChamorroGuatemalanGuyaneseHaitianHmongHonduranHopiHoumaHungarianIcelanderIndian (Asian)IndonesianInupiatIranianIraqiIrishIroquoisIsraeliItalianJamaicanJapaneseJordanianKenyanKiowaKoreanLaotianLatvianLebaneseLiberianLithuanianLumbeeLuxembourgerMacedonianMalaysianMalteseMarshalleseMenomineeMexicanMexican American IndianMongolianMoroccanNative HawaiianNavajoNepaleseNew ZealanderNicaraguanNigerianNorthern EuropeanNorwegianOkinawanOsageOttawaPaiutePakistaniPalestinianPanamanianParaguayanPennsylvania GermanPeruvianPimaPolishPortuguesePotawatomiPuebloPuerto RicanPuget Sound SalishRomanianRussianSalvadoranSamoanScandinavianScotch-IrishScottishSeminoleSenegaleseSerbianShoshoneSierra LeoneanSiouxSlavicSlovakSloveneSomaliSouth AfricanSouth AmericanSouth American IndianSoviet UnionSpaniardSpanishSpanish AmericanSpanish American IndianSri LankanSubsaharan AfricanSudaneseSwedishSwissSyrianTaiwaneseThaiTlingit-HaidaTohono O'OdhamTonganTrinidadian and TobagonianTsimshianTurkishU.S. Virgin IslanderUgandanUkrainianUruguayanUteVenezuelanVietnameseWelshWest IndianYakamaYaquiYugoslavianYumanYup'ikZimbabwean
Immigration
NonimmigrantsImmigrantsAfghanistanAfricaAlbaniaArgentinaArmeniaAsiaAustraliaAustriaBahamasBangladeshBarbadosBelarusBelgiumBelizeBoliviaBosnia and HerzegovinaBrazilBulgariaBurma/MyanmarCabo VerdeCambodiaCameroonCanadaCaribbeanCentral AmericaChileChinaColombiaCongoCosta RicaCroatiaCubaCzechoslovakiaDenmarkDominicaDominican RepublicEastern AfricaEastern AsiaEastern EuropeEcuadorEgyptEl SalvadorEnglandEritreaEthiopiaEuropeFijiFranceGermanyGhanaGreeceGrenadaGuatemalaGuyanaHaitiHondurasHong KongHungaryIndiaIndonesiaIranIraqIrelandIsraelItalyJamaicaJapanJordanKazakhstanKenyaKoreaKuwaitLaosLatin AmericaLatviaLebanonLiberiaLithuaniaMalaysiaMexicoMicronesiaMiddle AfricaMoldovaMoroccoNepalNetherlandsNicaraguaNigeriaNorth AmericaNorthern AfricaNorthern EuropeNorwayOceaniaPakistanPanamaPeruPhilippinesPolandPortugalRomaniaRussiaSaudi ArabiaScotlandSenegalSerbiaSierra LeoneSingaporeSomaliaSouth AfricaSouth AmericaSouth Central AsiaSouth Eastern AsiaSouthern EuropeSpainSri LankaSt. Vincent and the GrenadinesSudanSwedenSwitzerlandSyriaTaiwanThailandTrinidad and TobagoTurkeyUgandaUkraineUruguayUzbekistanVenezuelaVietnamWest IndiesWestern AfricaWestern AsiaWestern EuropeYemenZaireZimbabweAzores
Single Female Poverty
Income
Poverty
Unemployment
Labor Participation
Family Structure
Vehicle Availability
Education Level
Disability

Single Female Poverty Comparison

Immigrants from North Macedonia

Arabs

Exceptional
Good
18.5%
SINGLE FEMALE POVERTY
99.9/ 100
METRIC RATING
30th/ 347
METRIC RANK
20.7%
SINGLE FEMALE POVERTY
70.8/ 100
METRIC RATING
160th/ 347
METRIC RANK

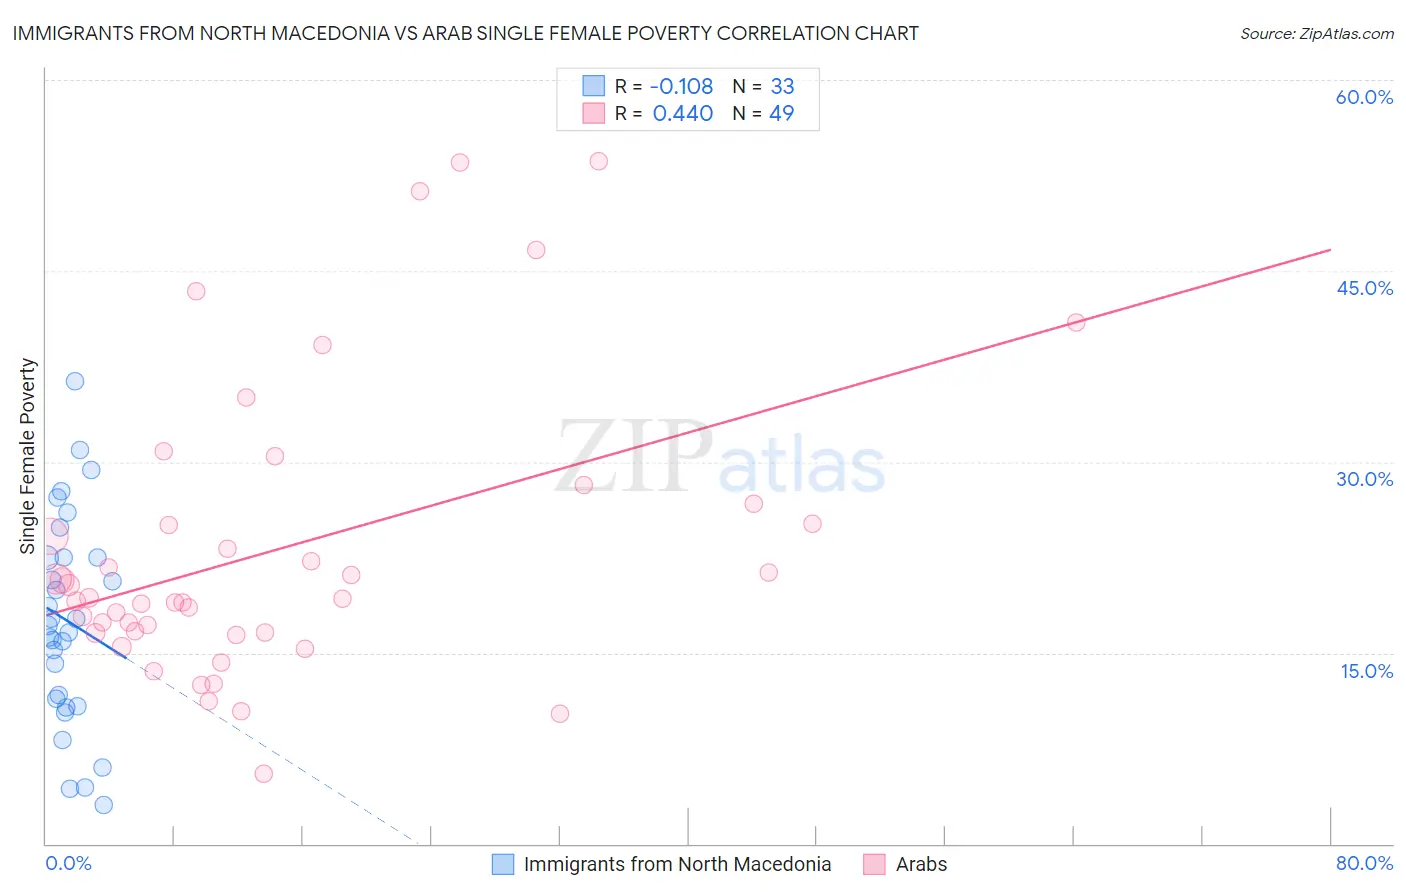
Immigrants from North Macedonia vs Arab Single Female Poverty Correlation Chart

The statistical analysis conducted on geographies consisting of 73,825,100 people shows a poor negative correlation between the proportion of Immigrants from North Macedonia and poverty level among single females in the United States with a correlation coefficient (R) of -0.108 and weighted average of 18.5%. Similarly, the statistical analysis conducted on geographies consisting of 476,036,809 people shows a moderate positive correlation between the proportion of Arabs and poverty level among single females in the United States with a correlation coefficient (R) of 0.440 and weighted average of 20.7%, a difference of 11.7%.
Immigrants from North Macedonia vs Arab Single Female Poverty

Single Female Poverty Correlation Summary

MeasurementImmigrants from North MacedoniaArab
Minimum3.0%5.5%
Maximum36.4%53.6%
Range33.3%48.1%
Mean17.5%23.1%
Median17.2%19.2%
Interquartile 25% (IQ1)11.1%16.6%
Interquartile 75% (IQ3)22.5%25.9%
Interquartile Range (IQR)11.4%9.4%
Standard Deviation (Sample)8.1%11.4%
Standard Deviation (Population)8.0%11.3%

Similar Demographics by Single Female Poverty

Demographics Similar to Immigrants from North Macedonia by Single Female Poverty

In terms of single female poverty, the demographic groups most similar to Immigrants from North Macedonia are Immigrants from Asia (18.6%, a difference of 0.050%), Immigrants from Sri Lanka (18.6%, a difference of 0.14%), Immigrants from Poland (18.5%, a difference of 0.16%), Immigrants from Philippines (18.6%, a difference of 0.20%), and Immigrants from Moldova (18.5%, a difference of 0.26%).
DemographicsRating | RankSingle Female Poverty
Asians
100.0
/100
|
#23
Exceptional
18.3%
Armenians
100.0
/100
|
#24
Exceptional
18.3%
Immigrants | Singapore
100.0
/100
|
#25
Exceptional
18.3%
Immigrants | Israel
100.0
/100
|
#26
Exceptional
18.3%
Immigrants | Pakistan
100.0
/100
|
#27
Exceptional
18.4%
Immigrants | Moldova
100.0
/100
|
#28
Exceptional
18.5%
Immigrants | Poland
100.0
/100
|
#29
Exceptional
18.5%
Immigrants | North Macedonia
99.9
/100
|
#30
Exceptional
18.5%
Immigrants | Asia
99.9
/100
|
#31
Exceptional
18.6%
Immigrants | Sri Lanka
99.9
/100
|
#32
Exceptional
18.6%
Immigrants | Philippines
99.9
/100
|
#33
Exceptional
18.6%
Koreans
99.9
/100
|
#34
Exceptional
18.6%
Immigrants | Japan
99.9
/100
|
#35
Exceptional
18.6%
Turks
99.9
/100
|
#36
Exceptional
18.7%
Immigrants | Armenia
99.9
/100
|
#37
Exceptional
18.7%

Demographics Similar to Arabs by Single Female Poverty

In terms of single female poverty, the demographic groups most similar to Arabs are Costa Rican (20.7%, a difference of 0.080%), Danish (20.7%, a difference of 0.17%), Kenyan (20.8%, a difference of 0.18%), Northern European (20.8%, a difference of 0.18%), and Lebanese (20.8%, a difference of 0.24%).
DemographicsRating | RankSingle Female Poverty
Swedes
77.1
/100
|
#153
Good
20.6%
Immigrants | Western Europe
76.7
/100
|
#154
Good
20.6%
Samoans
76.0
/100
|
#155
Good
20.6%
South American Indians
75.7
/100
|
#156
Good
20.6%
Immigrants | Oceania
74.3
/100
|
#157
Good
20.7%
Danes
73.0
/100
|
#158
Good
20.7%
Costa Ricans
71.8
/100
|
#159
Good
20.7%
Arabs
70.8
/100
|
#160
Good
20.7%
Kenyans
68.5
/100
|
#161
Good
20.8%
Northern Europeans
68.4
/100
|
#162
Good
20.8%
Lebanese
67.6
/100
|
#163
Good
20.8%
Iraqis
64.5
/100
|
#164
Good
20.8%
Ugandans
64.0
/100
|
#165
Good
20.8%
Norwegians
63.0
/100
|
#166
Good
20.8%
Immigrants | Norway
63.0
/100
|
#167
Good
20.8%