Immigrants from North America vs Italian Female Poverty Among 25-34 Year Olds
COMPARE
Immigrants from North America
Italian
Female Poverty Among 25-34 Year Olds
Female Poverty Among 25-34 Year Olds Comparison
Immigrants from North America
Italians
12.9%
FEMALE POVERTY AMONG 25-34 YEAR OLDS
89.7/ 100
METRIC RATING
129th/ 347
METRIC RANK
12.5%
FEMALE POVERTY AMONG 25-34 YEAR OLDS
97.2/ 100
METRIC RATING
89th/ 347
METRIC RANK
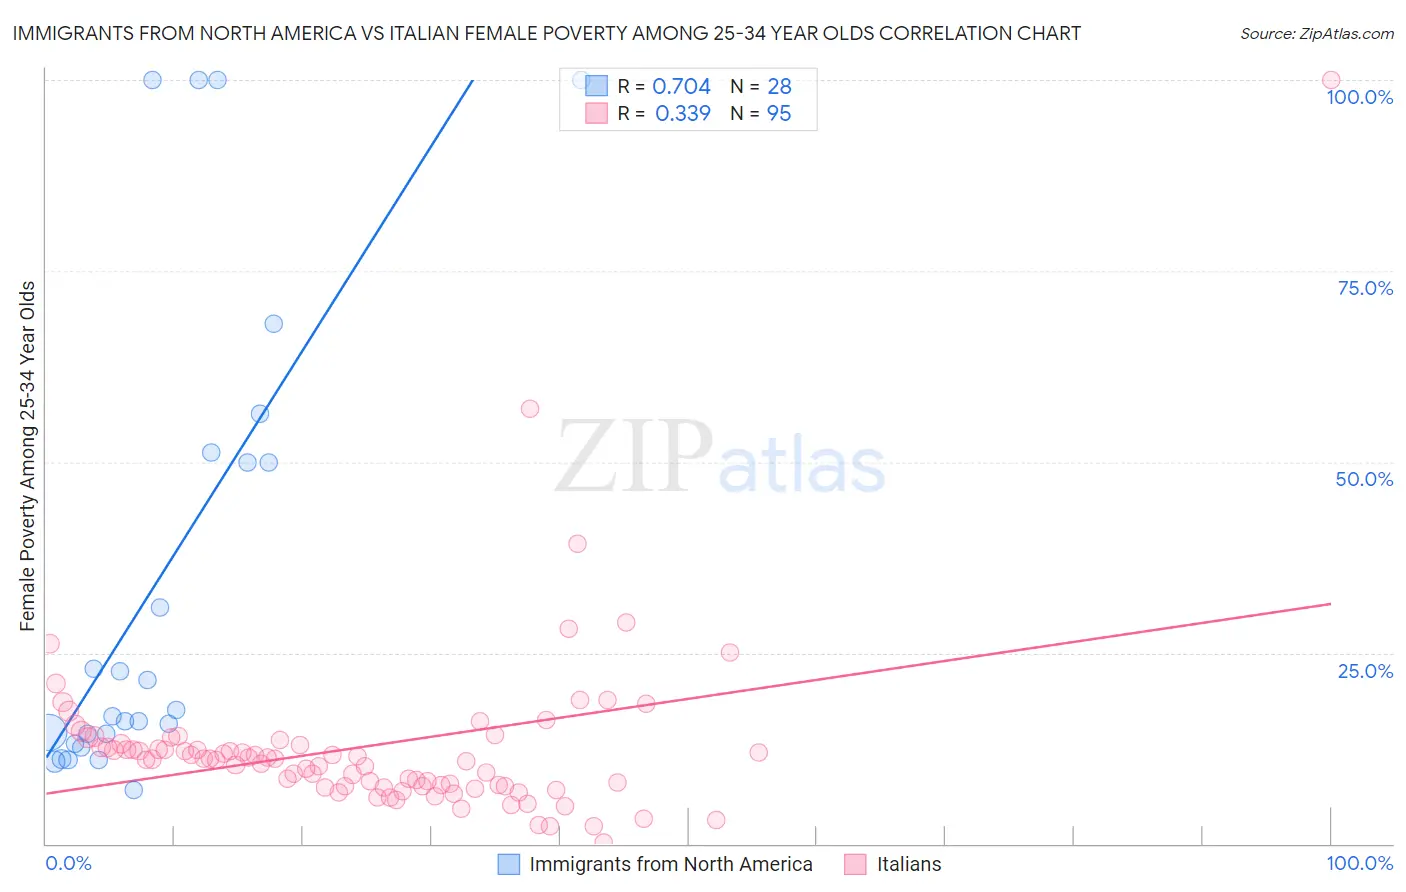
Immigrants from North America vs Italian Female Poverty Among 25-34 Year Olds Correlation Chart
The statistical analysis conducted on geographies consisting of 451,227,492 people shows a strong positive correlation between the proportion of Immigrants from North America and poverty level among females between the ages 25 and 34 in the United States with a correlation coefficient (R) of 0.704 and weighted average of 12.9%. Similarly, the statistical analysis conducted on geographies consisting of 551,961,209 people shows a mild positive correlation between the proportion of Italians and poverty level among females between the ages 25 and 34 in the United States with a correlation coefficient (R) of 0.339 and weighted average of 12.5%, a difference of 3.1%.
Female Poverty Among 25-34 Year Olds Correlation Summary
| Measurement | Immigrants from North America | Italian |
| Minimum | 7.1% | 0.18% |
| Maximum | 100.0% | 100.0% |
| Range | 92.9% | 99.8% |
| Mean | 34.8% | 12.7% |
| Median | 17.1% | 11.1% |
| Interquartile 25% (IQ1) | 13.7% | 7.5% |
| Interquartile 75% (IQ3) | 50.6% | 13.1% |
| Interquartile Range (IQR) | 36.9% | 5.5% |
| Standard Deviation (Sample) | 31.5% | 11.8% |
| Standard Deviation (Population) | 30.9% | 11.8% |
Similar Demographics by Female Poverty Among 25-34 Year Olds
Demographics Similar to Immigrants from North America by Female Poverty Among 25-34 Year Olds
In terms of female poverty among 25-34 year olds, the demographic groups most similar to Immigrants from North America are Immigrants from Uzbekistan (12.9%, a difference of 0.030%), Syrian (12.9%, a difference of 0.12%), Czech (12.9%, a difference of 0.13%), Pakistani (13.0%, a difference of 0.30%), and Immigrants from Hungary (13.0%, a difference of 0.32%).
| Demographics | Rating | Rank | Female Poverty Among 25-34 Year Olds |
| Immigrants | Western Asia | 92.7 /100 | #122 | Exceptional 12.8% |
| Slovenes | 92.7 /100 | #123 | Exceptional 12.8% |
| Immigrants | Netherlands | 92.0 /100 | #124 | Exceptional 12.8% |
| Immigrants | Canada | 91.5 /100 | #125 | Exceptional 12.9% |
| Immigrants | Fiji | 91.2 /100 | #126 | Exceptional 12.9% |
| Czechs | 90.3 /100 | #127 | Exceptional 12.9% |
| Syrians | 90.2 /100 | #128 | Exceptional 12.9% |
| Immigrants | North America | 89.7 /100 | #129 | Excellent 12.9% |
| Immigrants | Uzbekistan | 89.6 /100 | #130 | Excellent 12.9% |
| Pakistanis | 88.4 /100 | #131 | Excellent 13.0% |
| Immigrants | Hungary | 88.3 /100 | #132 | Excellent 13.0% |
| Serbians | 87.6 /100 | #133 | Excellent 13.0% |
| Afghans | 85.8 /100 | #134 | Excellent 13.0% |
| South Africans | 85.7 /100 | #135 | Excellent 13.0% |
| Immigrants | England | 85.5 /100 | #136 | Excellent 13.0% |
Demographics Similar to Italians by Female Poverty Among 25-34 Year Olds
In terms of female poverty among 25-34 year olds, the demographic groups most similar to Italians are Immigrants from Albania (12.5%, a difference of 0.15%), Immigrants from Austria (12.5%, a difference of 0.17%), Argentinean (12.5%, a difference of 0.24%), Norwegian (12.6%, a difference of 0.25%), and Croatian (12.5%, a difference of 0.27%).
| Demographics | Rating | Rank | Female Poverty Among 25-34 Year Olds |
| Ethiopians | 98.0 /100 | #82 | Exceptional 12.4% |
| Albanians | 97.7 /100 | #83 | Exceptional 12.5% |
| Immigrants | Latvia | 97.7 /100 | #84 | Exceptional 12.5% |
| Immigrants | South Eastern Asia | 97.6 /100 | #85 | Exceptional 12.5% |
| Croatians | 97.5 /100 | #86 | Exceptional 12.5% |
| Argentineans | 97.5 /100 | #87 | Exceptional 12.5% |
| Immigrants | Austria | 97.4 /100 | #88 | Exceptional 12.5% |
| Italians | 97.2 /100 | #89 | Exceptional 12.5% |
| Immigrants | Albania | 97.1 /100 | #90 | Exceptional 12.5% |
| Norwegians | 96.9 /100 | #91 | Exceptional 12.6% |
| Immigrants | Armenia | 96.9 /100 | #92 | Exceptional 12.6% |
| Palestinians | 96.9 /100 | #93 | Exceptional 12.6% |
| Immigrants | France | 96.8 /100 | #94 | Exceptional 12.6% |
| Ukrainians | 96.7 /100 | #95 | Exceptional 12.6% |
| Immigrants | Zimbabwe | 96.7 /100 | #96 | Exceptional 12.6% |