Immigrants from North America vs Fijian Female Poverty Among 25-34 Year Olds
COMPARE
Immigrants from North America
Fijian
Female Poverty Among 25-34 Year Olds
Female Poverty Among 25-34 Year Olds Comparison
Immigrants from North America
Fijians
12.9%
FEMALE POVERTY AMONG 25-34 YEAR OLDS
89.7/ 100
METRIC RATING
129th/ 347
METRIC RANK
15.9%
FEMALE POVERTY AMONG 25-34 YEAR OLDS
0.0/ 100
METRIC RATING
279th/ 347
METRIC RANK
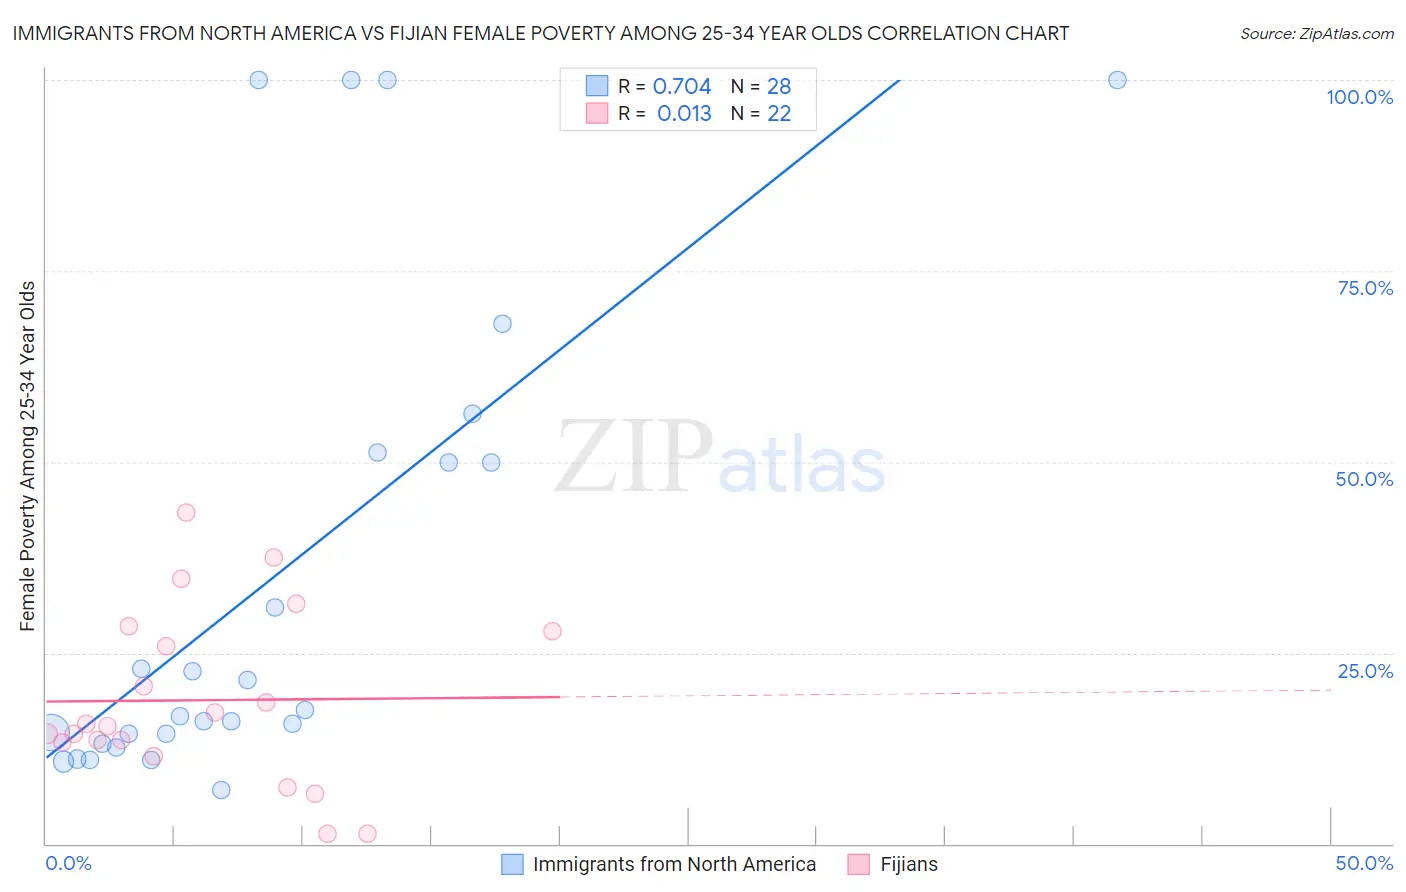
Immigrants from North America vs Fijian Female Poverty Among 25-34 Year Olds Correlation Chart
The statistical analysis conducted on geographies consisting of 451,227,492 people shows a strong positive correlation between the proportion of Immigrants from North America and poverty level among females between the ages 25 and 34 in the United States with a correlation coefficient (R) of 0.704 and weighted average of 12.9%. Similarly, the statistical analysis conducted on geographies consisting of 55,805,366 people shows no correlation between the proportion of Fijians and poverty level among females between the ages 25 and 34 in the United States with a correlation coefficient (R) of 0.013 and weighted average of 15.9%, a difference of 22.9%.
Female Poverty Among 25-34 Year Olds Correlation Summary
| Measurement | Immigrants from North America | Fijian |
| Minimum | 7.1% | 1.2% |
| Maximum | 100.0% | 43.3% |
| Range | 92.9% | 42.1% |
| Mean | 34.8% | 18.8% |
| Median | 17.1% | 15.6% |
| Interquartile 25% (IQ1) | 13.7% | 13.2% |
| Interquartile 75% (IQ3) | 50.6% | 27.8% |
| Interquartile Range (IQR) | 36.9% | 14.5% |
| Standard Deviation (Sample) | 31.5% | 11.3% |
| Standard Deviation (Population) | 30.9% | 11.1% |
Similar Demographics by Female Poverty Among 25-34 Year Olds
Demographics Similar to Immigrants from North America by Female Poverty Among 25-34 Year Olds
In terms of female poverty among 25-34 year olds, the demographic groups most similar to Immigrants from North America are Immigrants from Uzbekistan (12.9%, a difference of 0.030%), Syrian (12.9%, a difference of 0.12%), Czech (12.9%, a difference of 0.13%), Pakistani (13.0%, a difference of 0.30%), and Immigrants from Hungary (13.0%, a difference of 0.32%).
| Demographics | Rating | Rank | Female Poverty Among 25-34 Year Olds |
| Immigrants | Western Asia | 92.7 /100 | #122 | Exceptional 12.8% |
| Slovenes | 92.7 /100 | #123 | Exceptional 12.8% |
| Immigrants | Netherlands | 92.0 /100 | #124 | Exceptional 12.8% |
| Immigrants | Canada | 91.5 /100 | #125 | Exceptional 12.9% |
| Immigrants | Fiji | 91.2 /100 | #126 | Exceptional 12.9% |
| Czechs | 90.3 /100 | #127 | Exceptional 12.9% |
| Syrians | 90.2 /100 | #128 | Exceptional 12.9% |
| Immigrants | North America | 89.7 /100 | #129 | Excellent 12.9% |
| Immigrants | Uzbekistan | 89.6 /100 | #130 | Excellent 12.9% |
| Pakistanis | 88.4 /100 | #131 | Excellent 13.0% |
| Immigrants | Hungary | 88.3 /100 | #132 | Excellent 13.0% |
| Serbians | 87.6 /100 | #133 | Excellent 13.0% |
| Afghans | 85.8 /100 | #134 | Excellent 13.0% |
| South Africans | 85.7 /100 | #135 | Excellent 13.0% |
| Immigrants | England | 85.5 /100 | #136 | Excellent 13.0% |
Demographics Similar to Fijians by Female Poverty Among 25-34 Year Olds
In terms of female poverty among 25-34 year olds, the demographic groups most similar to Fijians are French American Indian (15.9%, a difference of 0.0%), Bangladeshi (15.9%, a difference of 0.16%), Immigrants from Micronesia (15.8%, a difference of 0.29%), Immigrants from Zaire (15.8%, a difference of 0.30%), and Immigrants from Latin America (16.0%, a difference of 0.67%).
| Demographics | Rating | Rank | Female Poverty Among 25-34 Year Olds |
| Senegalese | 0.1 /100 | #272 | Tragic 15.6% |
| Immigrants | Nonimmigrants | 0.1 /100 | #273 | Tragic 15.6% |
| Immigrants | Caribbean | 0.0 /100 | #274 | Tragic 15.7% |
| Immigrants | Azores | 0.0 /100 | #275 | Tragic 15.8% |
| Immigrants | Zaire | 0.0 /100 | #276 | Tragic 15.8% |
| Immigrants | Micronesia | 0.0 /100 | #277 | Tragic 15.8% |
| French American Indians | 0.0 /100 | #278 | Tragic 15.9% |
| Fijians | 0.0 /100 | #279 | Tragic 15.9% |
| Bangladeshis | 0.0 /100 | #280 | Tragic 15.9% |
| Immigrants | Latin America | 0.0 /100 | #281 | Tragic 16.0% |
| Aleuts | 0.0 /100 | #282 | Tragic 16.1% |
| Bahamians | 0.0 /100 | #283 | Tragic 16.1% |
| Shoshone | 0.0 /100 | #284 | Tragic 16.2% |
| Immigrants | Bahamas | 0.0 /100 | #285 | Tragic 16.3% |
| Cape Verdeans | 0.0 /100 | #286 | Tragic 16.3% |