Immigrants from Nigeria vs Tsimshian Male Poverty
COMPARE
Immigrants from Nigeria
Tsimshian
Male Poverty
Male Poverty Comparison
Immigrants from Nigeria
Tsimshian
12.3%
MALE POVERTY
1.6/ 100
METRIC RATING
224th/ 347
METRIC RANK
12.8%
MALE POVERTY
0.3/ 100
METRIC RATING
244th/ 347
METRIC RANK
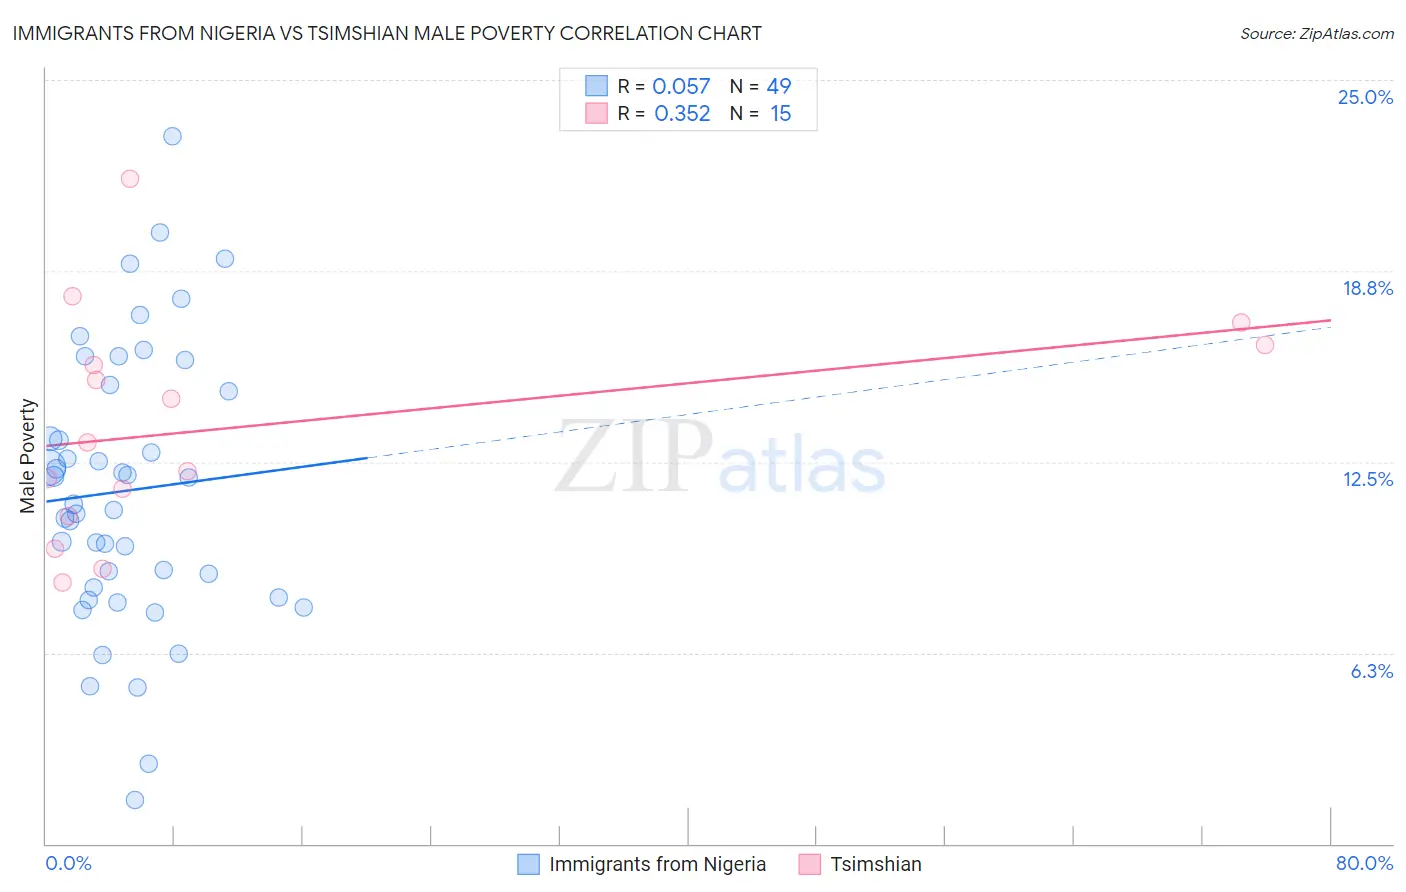
Immigrants from Nigeria vs Tsimshian Male Poverty Correlation Chart
The statistical analysis conducted on geographies consisting of 283,241,379 people shows a slight positive correlation between the proportion of Immigrants from Nigeria and poverty level among males in the United States with a correlation coefficient (R) of 0.057 and weighted average of 12.3%. Similarly, the statistical analysis conducted on geographies consisting of 15,624,889 people shows a mild positive correlation between the proportion of Tsimshian and poverty level among males in the United States with a correlation coefficient (R) of 0.352 and weighted average of 12.8%, a difference of 3.9%.
Male Poverty Correlation Summary
| Measurement | Immigrants from Nigeria | Tsimshian |
| Minimum | 1.4% | 8.5% |
| Maximum | 23.1% | 21.8% |
| Range | 21.7% | 13.2% |
| Mean | 11.6% | 13.7% |
| Median | 11.1% | 13.1% |
| Interquartile 25% (IQ1) | 8.2% | 10.7% |
| Interquartile 75% (IQ3) | 14.9% | 16.3% |
| Interquartile Range (IQR) | 6.7% | 5.6% |
| Standard Deviation (Sample) | 4.5% | 3.7% |
| Standard Deviation (Population) | 4.5% | 3.6% |
Demographics Similar to Immigrants from Nigeria and Tsimshian by Male Poverty
In terms of male poverty, the demographic groups most similar to Immigrants from Nigeria are Osage (12.3%, a difference of 0.060%), Nigerian (12.3%, a difference of 0.22%), Alaska Native (12.4%, a difference of 0.32%), Alsatian (12.4%, a difference of 0.36%), and Cuban (12.4%, a difference of 0.45%). Similarly, the demographic groups most similar to Tsimshian are Alaskan Athabascan (12.8%, a difference of 0.11%), Nepalese (12.8%, a difference of 0.14%), Sudanese (12.8%, a difference of 0.31%), Immigrants from Middle Africa (12.7%, a difference of 0.67%), and Ecuadorian (12.7%, a difference of 0.95%).
| Demographics | Rating | Rank | Male Poverty |
| Immigrants | Nigeria | 1.6 /100 | #224 | Tragic 12.3% |
| Osage | 1.5 /100 | #225 | Tragic 12.3% |
| Nigerians | 1.4 /100 | #226 | Tragic 12.3% |
| Alaska Natives | 1.4 /100 | #227 | Tragic 12.4% |
| Alsatians | 1.3 /100 | #228 | Tragic 12.4% |
| Cubans | 1.3 /100 | #229 | Tragic 12.4% |
| Marshallese | 0.8 /100 | #230 | Tragic 12.5% |
| Salvadorans | 0.6 /100 | #231 | Tragic 12.6% |
| Nicaraguans | 0.6 /100 | #232 | Tragic 12.6% |
| Fijians | 0.6 /100 | #233 | Tragic 12.6% |
| Immigrants | Armenia | 0.6 /100 | #234 | Tragic 12.6% |
| Immigrants | Laos | 0.5 /100 | #235 | Tragic 12.6% |
| Immigrants | Saudi Arabia | 0.4 /100 | #236 | Tragic 12.7% |
| French American Indians | 0.4 /100 | #237 | Tragic 12.7% |
| Ecuadorians | 0.4 /100 | #238 | Tragic 12.7% |
| Ghanaians | 0.4 /100 | #239 | Tragic 12.7% |
| Immigrants | Middle Africa | 0.4 /100 | #240 | Tragic 12.7% |
| Sudanese | 0.3 /100 | #241 | Tragic 12.8% |
| Nepalese | 0.3 /100 | #242 | Tragic 12.8% |
| Alaskan Athabascans | 0.3 /100 | #243 | Tragic 12.8% |
| Tsimshian | 0.3 /100 | #244 | Tragic 12.8% |