Immigrants from Nigeria vs Immigrants from Sri Lanka Female Poverty Among 18-24 Year Olds

COMPARE

Immigrants from Nigeria
Race
Ancestry
AfghanAfricanAlaska NativeAlaskan AthabascanAlbanianAleutAlsatianAmericanApacheArabArapahoArgentineanArmenianAssyrian/Chaldean/SyriacAustralianAustrianBahamianBangladeshiBarbadianBasqueBelgianBelizeanBermudanBhutaneseBlackfeetBolivianBrazilianBritishBritish West IndianBulgarianBurmeseCajunCambodianCanadianCape VerdeanCarpatho RusynCelticCentral AmericanCentral American IndianCherokeeCheyenneChickasawChileanChineseChippewaChoctawColombianColvilleComancheCosta RicanCreeCreekCroatianCrowCubanCypriotCzechCzechoslovakianDanishDelawareDominicanDutchDutch West IndianEastern EuropeanEcuadorianEgyptianEnglishEstonianEthiopianEuropeanFijianFilipinoFinnishFrenchFrench American IndianFrench CanadianGermanGerman RussianGhanaianGreekGuamanian/ChamorroGuatemalanGuyaneseHaitianHmongHonduranHopiHoumaHungarianIcelanderIndian (Asian)IndonesianInupiatIranianIraqiIrishIroquoisIsraeliItalianJamaicanJapaneseJordanianKenyanKiowaKoreanLaotianLatvianLebaneseLiberianLithuanianLumbeeLuxembourgerMacedonianMalaysianMalteseMarshalleseMenomineeMexicanMexican American IndianMongolianMoroccanNative HawaiianNavajoNepaleseNew ZealanderNicaraguanNigerianNorthern EuropeanNorwegianOkinawanOsageOttawaPaiutePakistaniPalestinianPanamanianParaguayanPennsylvania GermanPeruvianPimaPolishPortuguesePotawatomiPuebloPuerto RicanPuget Sound SalishRomanianRussianSalvadoranSamoanScandinavianScotch-IrishScottishSeminoleSenegaleseSerbianShoshoneSierra LeoneanSiouxSlavicSlovakSloveneSomaliSouth AfricanSouth AmericanSouth American IndianSoviet UnionSpaniardSpanishSpanish AmericanSpanish American IndianSri LankanSubsaharan AfricanSudaneseSwedishSwissSyrianTaiwaneseThaiTlingit-HaidaTohono O'OdhamTonganTrinidadian and TobagonianTsimshianTurkishU.S. Virgin IslanderUgandanUkrainianUruguayanUteVenezuelanVietnameseWelshWest IndianYakamaYaquiYugoslavianYumanYup'ikZimbabwean
Immigration
NonimmigrantsImmigrantsAfghanistanAfricaAlbaniaArgentinaArmeniaAsiaAustraliaAustriaBahamasBangladeshBarbadosBelarusBelgiumBelizeBoliviaBosnia and HerzegovinaBrazilBulgariaBurma/MyanmarCabo VerdeCambodiaCameroonCanadaCaribbeanCentral AmericaChileChinaColombiaCongoCosta RicaCroatiaCubaCzechoslovakiaDenmarkDominicaDominican RepublicEastern AfricaEastern AsiaEastern EuropeEcuadorEgyptEl SalvadorEnglandEritreaEthiopiaEuropeFijiFranceGermanyGhanaGreeceGrenadaGuatemalaGuyanaHaitiHondurasHong KongHungaryIndiaIndonesiaIranIraqIrelandIsraelItalyJamaicaJapanJordanKazakhstanKenyaKoreaKuwaitLaosLatin AmericaLatviaLebanonLiberiaLithuaniaMalaysiaMexicoMicronesiaMiddle AfricaMoldovaMoroccoNepalNetherlandsNicaraguaNigeriaNorth AmericaNorth MacedoniaNorthern AfricaNorthern EuropeNorwayOceaniaPakistanPanamaPeruPhilippinesPolandPortugalRomaniaRussiaSaudi ArabiaScotlandSenegalSerbiaSierra LeoneSingaporeSomaliaSouth AfricaSouth AmericaSouth Central AsiaSouth Eastern AsiaSouthern EuropeSpainSt. Vincent and the GrenadinesSudanSwedenSwitzerlandSyriaTaiwanThailandTrinidad and TobagoTurkeyUgandaUkraineUruguayUzbekistanVenezuelaVietnamWest IndiesWestern AfricaWestern AsiaWestern EuropeYemenZaireZimbabweAzores
Immigrants from Sri Lanka
Race
Ancestry
AfghanAfricanAlaska NativeAlaskan AthabascanAlbanianAleutAlsatianAmericanApacheArabArapahoArgentineanArmenianAssyrian/Chaldean/SyriacAustralianAustrianBahamianBangladeshiBarbadianBasqueBelgianBelizeanBermudanBhutaneseBlackfeetBolivianBrazilianBritishBritish West IndianBulgarianBurmeseCajunCambodianCanadianCape VerdeanCarpatho RusynCelticCentral AmericanCentral American IndianCherokeeCheyenneChickasawChileanChineseChippewaChoctawColombianColvilleComancheCosta RicanCreeCreekCroatianCrowCubanCypriotCzechCzechoslovakianDanishDelawareDominicanDutchDutch West IndianEastern EuropeanEcuadorianEgyptianEnglishEstonianEthiopianEuropeanFijianFilipinoFinnishFrenchFrench American IndianFrench CanadianGermanGerman RussianGhanaianGreekGuamanian/ChamorroGuatemalanGuyaneseHaitianHmongHonduranHopiHoumaHungarianIcelanderIndian (Asian)IndonesianInupiatIranianIraqiIrishIroquoisIsraeliItalianJamaicanJapaneseJordanianKenyanKiowaKoreanLaotianLatvianLebaneseLiberianLithuanianLumbeeLuxembourgerMacedonianMalaysianMalteseMarshalleseMenomineeMexicanMexican American IndianMongolianMoroccanNative HawaiianNavajoNepaleseNew ZealanderNicaraguanNigerianNorthern EuropeanNorwegianOkinawanOsageOttawaPaiutePakistaniPalestinianPanamanianParaguayanPennsylvania GermanPeruvianPimaPolishPortuguesePotawatomiPuebloPuerto RicanPuget Sound SalishRomanianRussianSalvadoranSamoanScandinavianScotch-IrishScottishSeminoleSenegaleseSerbianShoshoneSierra LeoneanSiouxSlavicSlovakSloveneSomaliSouth AfricanSouth AmericanSouth American IndianSoviet UnionSpaniardSpanishSpanish AmericanSpanish American IndianSri LankanSubsaharan AfricanSudaneseSwedishSwissSyrianTaiwaneseThaiTlingit-HaidaTohono O'OdhamTonganTrinidadian and TobagonianTsimshianTurkishU.S. Virgin IslanderUgandanUkrainianUruguayanUteVenezuelanVietnameseWelshWest IndianYakamaYaquiYugoslavianYumanYup'ikZimbabwean
Immigration
NonimmigrantsImmigrantsAfghanistanAfricaAlbaniaArgentinaArmeniaAsiaAustraliaAustriaBahamasBangladeshBarbadosBelarusBelgiumBelizeBoliviaBosnia and HerzegovinaBrazilBulgariaBurma/MyanmarCabo VerdeCambodiaCameroonCanadaCaribbeanCentral AmericaChileChinaColombiaCongoCosta RicaCroatiaCubaCzechoslovakiaDenmarkDominicaDominican RepublicEastern AfricaEastern AsiaEastern EuropeEcuadorEgyptEl SalvadorEnglandEritreaEthiopiaEuropeFijiFranceGermanyGhanaGreeceGrenadaGuatemalaGuyanaHaitiHondurasHong KongHungaryIndiaIndonesiaIranIraqIrelandIsraelItalyJamaicaJapanJordanKazakhstanKenyaKoreaKuwaitLaosLatin AmericaLatviaLebanonLiberiaLithuaniaMalaysiaMexicoMicronesiaMiddle AfricaMoldovaMoroccoNepalNetherlandsNicaraguaNorth AmericaNorth MacedoniaNorthern AfricaNorthern EuropeNorwayOceaniaPakistanPanamaPeruPhilippinesPolandPortugalRomaniaRussiaSaudi ArabiaScotlandSenegalSerbiaSierra LeoneSingaporeSomaliaSouth AfricaSouth AmericaSouth Central AsiaSouth Eastern AsiaSouthern EuropeSpainSri LankaSt. Vincent and the GrenadinesSudanSwedenSwitzerlandSyriaTaiwanThailandTrinidad and TobagoTurkeyUgandaUkraineUruguayUzbekistanVenezuelaVietnamWest IndiesWestern AfricaWestern AsiaWestern EuropeYemenZaireZimbabweAzores
Female Poverty Among 18-24 Year Olds
Income
Poverty
Unemployment
Labor Participation
Family Structure
Vehicle Availability
Education Level
Disability

Female Poverty Among 18-24 Year Olds Comparison

Immigrants from Nigeria

Immigrants from Sri Lanka

Average
Exceptional
20.1%
FEMALE POVERTY AMONG 18-24 YEAR OLDS
54.3/ 100
METRIC RATING
171st/ 347
METRIC RANK
19.2%
FEMALE POVERTY AMONG 18-24 YEAR OLDS
97.5/ 100
METRIC RATING
107th/ 347
METRIC RANK

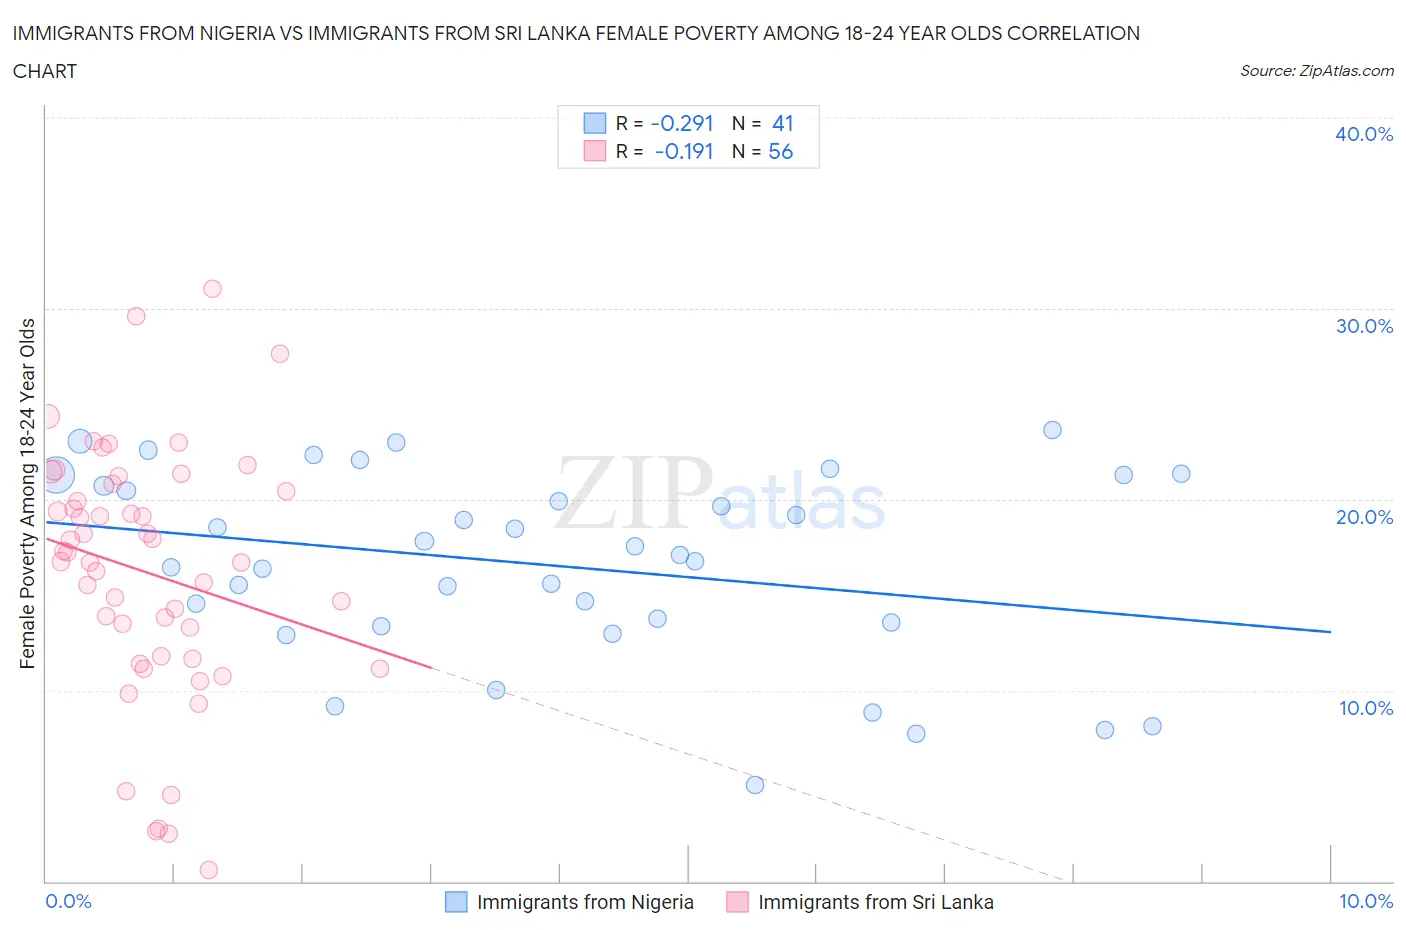
Immigrants from Nigeria vs Immigrants from Sri Lanka Female Poverty Among 18-24 Year Olds Correlation Chart

The statistical analysis conducted on geographies consisting of 279,729,730 people shows a weak negative correlation between the proportion of Immigrants from Nigeria and poverty level among females between the ages 18 and 24 in the United States with a correlation coefficient (R) of -0.291 and weighted average of 20.1%. Similarly, the statistical analysis conducted on geographies consisting of 148,449,032 people shows a poor negative correlation between the proportion of Immigrants from Sri Lanka and poverty level among females between the ages 18 and 24 in the United States with a correlation coefficient (R) of -0.191 and weighted average of 19.2%, a difference of 4.5%.
Immigrants from Nigeria vs Immigrants from Sri Lanka Female Poverty Among 18-24 Year Olds

Female Poverty Among 18-24 Year Olds Correlation Summary

MeasurementImmigrants from NigeriaImmigrants from Sri Lanka
Minimum5.1%0.58%
Maximum23.7%31.0%
Range18.6%30.5%
Mean16.6%16.2%
Median17.1%17.0%
Interquartile 25% (IQ1)13.5%11.7%
Interquartile 75% (IQ3)21.0%20.6%
Interquartile Range (IQR)7.5%8.9%
Standard Deviation (Sample)5.0%6.6%
Standard Deviation (Population)4.9%6.6%

Similar Demographics by Female Poverty Among 18-24 Year Olds

Demographics Similar to Immigrants from Nigeria by Female Poverty Among 18-24 Year Olds

In terms of female poverty among 18-24 year olds, the demographic groups most similar to Immigrants from Nigeria are Iranian (20.1%, a difference of 0.020%), Hmong (20.0%, a difference of 0.060%), Belizean (20.1%, a difference of 0.11%), Irish (20.1%, a difference of 0.21%), and Swedish (20.1%, a difference of 0.21%).
DemographicsRating | RankFemale Poverty Among 18-24 Year Olds
Central Americans
70.0
/100
|
#164
Good
19.9%
Eastern Europeans
69.3
/100
|
#165
Good
19.9%
Belgians
69.1
/100
|
#166
Good
19.9%
Czechoslovakians
61.8
/100
|
#167
Good
20.0%
Fijians
59.1
/100
|
#168
Average
20.0%
Hmong
55.4
/100
|
#169
Average
20.0%
Iranians
54.7
/100
|
#170
Average
20.1%
Immigrants | Nigeria
54.3
/100
|
#171
Average
20.1%
Belizeans
52.0
/100
|
#172
Average
20.1%
Irish
50.0
/100
|
#173
Average
20.1%
Swedes
50.0
/100
|
#174
Average
20.1%
South American Indians
48.4
/100
|
#175
Average
20.1%
Kenyans
44.9
/100
|
#176
Average
20.2%
Immigrants | Kazakhstan
44.2
/100
|
#177
Average
20.2%
Swiss
44.0
/100
|
#178
Average
20.2%

Demographics Similar to Immigrants from Sri Lanka by Female Poverty Among 18-24 Year Olds

In terms of female poverty among 18-24 year olds, the demographic groups most similar to Immigrants from Sri Lanka are Immigrants from Uzbekistan (19.2%, a difference of 0.090%), Immigrants from Sierra Leone (19.2%, a difference of 0.15%), Immigrants from Syria (19.2%, a difference of 0.17%), Immigrants from Ecuador (19.2%, a difference of 0.19%), and Laotian (19.2%, a difference of 0.20%).
DemographicsRating | RankFemale Poverty Among 18-24 Year Olds
Chileans
98.3
/100
|
#100
Exceptional
19.1%
Ecuadorians
98.1
/100
|
#101
Exceptional
19.1%
Immigrants | Caribbean
98.1
/100
|
#102
Exceptional
19.1%
Serbians
98.0
/100
|
#103
Exceptional
19.1%
Immigrants | Afghanistan
98.0
/100
|
#104
Exceptional
19.1%
Immigrants | Ecuador
97.8
/100
|
#105
Exceptional
19.2%
Immigrants | Sierra Leone
97.8
/100
|
#106
Exceptional
19.2%
Immigrants | Sri Lanka
97.5
/100
|
#107
Exceptional
19.2%
Immigrants | Uzbekistan
97.3
/100
|
#108
Exceptional
19.2%
Immigrants | Syria
97.2
/100
|
#109
Exceptional
19.2%
Laotians
97.1
/100
|
#110
Exceptional
19.2%
Immigrants | Serbia
97.1
/100
|
#111
Exceptional
19.2%
Immigrants | El Salvador
96.5
/100
|
#112
Exceptional
19.3%
Immigrants | Cameroon
96.3
/100
|
#113
Exceptional
19.3%
Slovenes
96.2
/100
|
#114
Exceptional
19.3%