Immigrants from Nigeria vs Afghan Female Poverty Among 18-24 Year Olds

COMPARE

Immigrants from Nigeria
Race
Ancestry
AfricanAlaska NativeAlaskan AthabascanAlbanianAleutAlsatianAmericanApacheArabArapahoArgentineanArmenianAssyrian/Chaldean/SyriacAustralianAustrianBahamianBangladeshiBarbadianBasqueBelgianBelizeanBermudanBhutaneseBlackfeetBolivianBrazilianBritishBritish West IndianBulgarianBurmeseCajunCambodianCanadianCape VerdeanCarpatho RusynCelticCentral AmericanCentral American IndianCherokeeCheyenneChickasawChileanChineseChippewaChoctawColombianColvilleComancheCosta RicanCreeCreekCroatianCrowCubanCypriotCzechCzechoslovakianDanishDelawareDominicanDutchDutch West IndianEastern EuropeanEcuadorianEgyptianEnglishEstonianEthiopianEuropeanFijianFilipinoFinnishFrenchFrench American IndianFrench CanadianGermanGerman RussianGhanaianGreekGuamanian/ChamorroGuatemalanGuyaneseHaitianHmongHonduranHopiHoumaHungarianIcelanderIndian (Asian)IndonesianInupiatIranianIraqiIrishIroquoisIsraeliItalianJamaicanJapaneseJordanianKenyanKiowaKoreanLaotianLatvianLebaneseLiberianLithuanianLumbeeLuxembourgerMacedonianMalaysianMalteseMarshalleseMenomineeMexicanMexican American IndianMongolianMoroccanNative HawaiianNavajoNepaleseNew ZealanderNicaraguanNigerianNorthern EuropeanNorwegianOkinawanOsageOttawaPaiutePakistaniPalestinianPanamanianParaguayanPennsylvania GermanPeruvianPimaPolishPortuguesePotawatomiPuebloPuerto RicanPuget Sound SalishRomanianRussianSalvadoranSamoanScandinavianScotch-IrishScottishSeminoleSenegaleseSerbianShoshoneSierra LeoneanSiouxSlavicSlovakSloveneSomaliSouth AfricanSouth AmericanSouth American IndianSoviet UnionSpaniardSpanishSpanish AmericanSpanish American IndianSri LankanSubsaharan AfricanSudaneseSwedishSwissSyrianTaiwaneseThaiTlingit-HaidaTohono O'OdhamTonganTrinidadian and TobagonianTsimshianTurkishU.S. Virgin IslanderUgandanUkrainianUruguayanUteVenezuelanVietnameseWelshWest IndianYakamaYaquiYugoslavianYumanYup'ikZimbabwean
Immigration
NonimmigrantsImmigrantsAfghanistanAfricaAlbaniaArgentinaArmeniaAsiaAustraliaAustriaBahamasBangladeshBarbadosBelarusBelgiumBelizeBoliviaBosnia and HerzegovinaBrazilBulgariaBurma/MyanmarCabo VerdeCambodiaCameroonCanadaCaribbeanCentral AmericaChileChinaColombiaCongoCosta RicaCroatiaCubaCzechoslovakiaDenmarkDominicaDominican RepublicEastern AfricaEastern AsiaEastern EuropeEcuadorEgyptEl SalvadorEnglandEritreaEthiopiaEuropeFijiFranceGermanyGhanaGreeceGrenadaGuatemalaGuyanaHaitiHondurasHong KongHungaryIndiaIndonesiaIranIraqIrelandIsraelItalyJamaicaJapanJordanKazakhstanKenyaKoreaKuwaitLaosLatin AmericaLatviaLebanonLiberiaLithuaniaMalaysiaMexicoMicronesiaMiddle AfricaMoldovaMoroccoNepalNetherlandsNicaraguaNigeriaNorth AmericaNorth MacedoniaNorthern AfricaNorthern EuropeNorwayOceaniaPakistanPanamaPeruPhilippinesPolandPortugalRomaniaRussiaSaudi ArabiaScotlandSenegalSerbiaSierra LeoneSingaporeSomaliaSouth AfricaSouth AmericaSouth Central AsiaSouth Eastern AsiaSouthern EuropeSpainSri LankaSt. Vincent and the GrenadinesSudanSwedenSwitzerlandSyriaTaiwanThailandTrinidad and TobagoTurkeyUgandaUkraineUruguayUzbekistanVenezuelaVietnamWest IndiesWestern AfricaWestern AsiaWestern EuropeYemenZaireZimbabweAzores
Afghan
Race
Ancestry
AfghanAfricanAlaska NativeAlaskan AthabascanAlbanianAleutAlsatianAmericanApacheArabArapahoArgentineanArmenianAssyrian/Chaldean/SyriacAustralianAustrianBahamianBangladeshiBarbadianBasqueBelgianBelizeanBermudanBhutaneseBlackfeetBolivianBrazilianBritishBritish West IndianBulgarianBurmeseCajunCambodianCanadianCape VerdeanCarpatho RusynCelticCentral AmericanCentral American IndianCherokeeCheyenneChickasawChileanChineseChippewaChoctawColombianColvilleComancheCosta RicanCreeCreekCroatianCrowCubanCypriotCzechCzechoslovakianDanishDelawareDominicanDutchDutch West IndianEastern EuropeanEcuadorianEgyptianEnglishEstonianEthiopianEuropeanFijianFilipinoFinnishFrenchFrench American IndianFrench CanadianGermanGerman RussianGhanaianGreekGuamanian/ChamorroGuatemalanGuyaneseHaitianHmongHonduranHopiHoumaHungarianIcelanderIndian (Asian)IndonesianInupiatIranianIraqiIrishIroquoisIsraeliItalianJamaicanJapaneseJordanianKenyanKiowaKoreanLaotianLatvianLebaneseLiberianLithuanianLumbeeLuxembourgerMacedonianMalaysianMalteseMarshalleseMenomineeMexicanMexican American IndianMongolianMoroccanNative HawaiianNavajoNepaleseNew ZealanderNicaraguanNigerianNorthern EuropeanNorwegianOkinawanOsageOttawaPaiutePakistaniPalestinianPanamanianParaguayanPennsylvania GermanPeruvianPimaPolishPortuguesePotawatomiPuebloPuerto RicanPuget Sound SalishRomanianRussianSalvadoranSamoanScandinavianScotch-IrishScottishSeminoleSenegaleseSerbianShoshoneSierra LeoneanSiouxSlavicSlovakSloveneSomaliSouth AfricanSouth AmericanSouth American IndianSoviet UnionSpaniardSpanishSpanish AmericanSpanish American IndianSri LankanSubsaharan AfricanSudaneseSwedishSwissSyrianTaiwaneseThaiTlingit-HaidaTohono O'OdhamTonganTrinidadian and TobagonianTsimshianTurkishU.S. Virgin IslanderUgandanUkrainianUruguayanUteVenezuelanVietnameseWelshWest IndianYakamaYaquiYugoslavianYumanYup'ikZimbabwean
Immigration
NonimmigrantsImmigrantsAfghanistanAfricaAlbaniaArgentinaArmeniaAsiaAustraliaAustriaBahamasBangladeshBarbadosBelarusBelgiumBelizeBoliviaBosnia and HerzegovinaBrazilBulgariaBurma/MyanmarCabo VerdeCambodiaCameroonCanadaCaribbeanCentral AmericaChileChinaColombiaCongoCosta RicaCroatiaCubaCzechoslovakiaDenmarkDominicaDominican RepublicEastern AfricaEastern AsiaEastern EuropeEcuadorEgyptEl SalvadorEnglandEritreaEthiopiaEuropeFijiFranceGermanyGhanaGreeceGrenadaGuatemalaGuyanaHaitiHondurasHong KongHungaryIndiaIndonesiaIranIraqIrelandIsraelItalyJamaicaJapanJordanKazakhstanKenyaKoreaKuwaitLaosLatin AmericaLatviaLebanonLiberiaLithuaniaMalaysiaMexicoMicronesiaMiddle AfricaMoldovaMoroccoNepalNetherlandsNicaraguaNorth AmericaNorth MacedoniaNorthern AfricaNorthern EuropeNorwayOceaniaPakistanPanamaPeruPhilippinesPolandPortugalRomaniaRussiaSaudi ArabiaScotlandSenegalSerbiaSierra LeoneSingaporeSomaliaSouth AfricaSouth AmericaSouth Central AsiaSouth Eastern AsiaSouthern EuropeSpainSri LankaSt. Vincent and the GrenadinesSudanSwedenSwitzerlandSyriaTaiwanThailandTrinidad and TobagoTurkeyUgandaUkraineUruguayUzbekistanVenezuelaVietnamWest IndiesWestern AfricaWestern AsiaWestern EuropeYemenZaireZimbabweAzores
Female Poverty Among 18-24 Year Olds
Income
Poverty
Unemployment
Labor Participation
Family Structure
Vehicle Availability
Education Level
Disability

Female Poverty Among 18-24 Year Olds Comparison

Immigrants from Nigeria

Afghans

Average
Exceptional
20.1%
FEMALE POVERTY AMONG 18-24 YEAR OLDS
54.3/ 100
METRIC RATING
171st/ 347
METRIC RANK
19.0%
FEMALE POVERTY AMONG 18-24 YEAR OLDS
99.0/ 100
METRIC RATING
90th/ 347
METRIC RANK

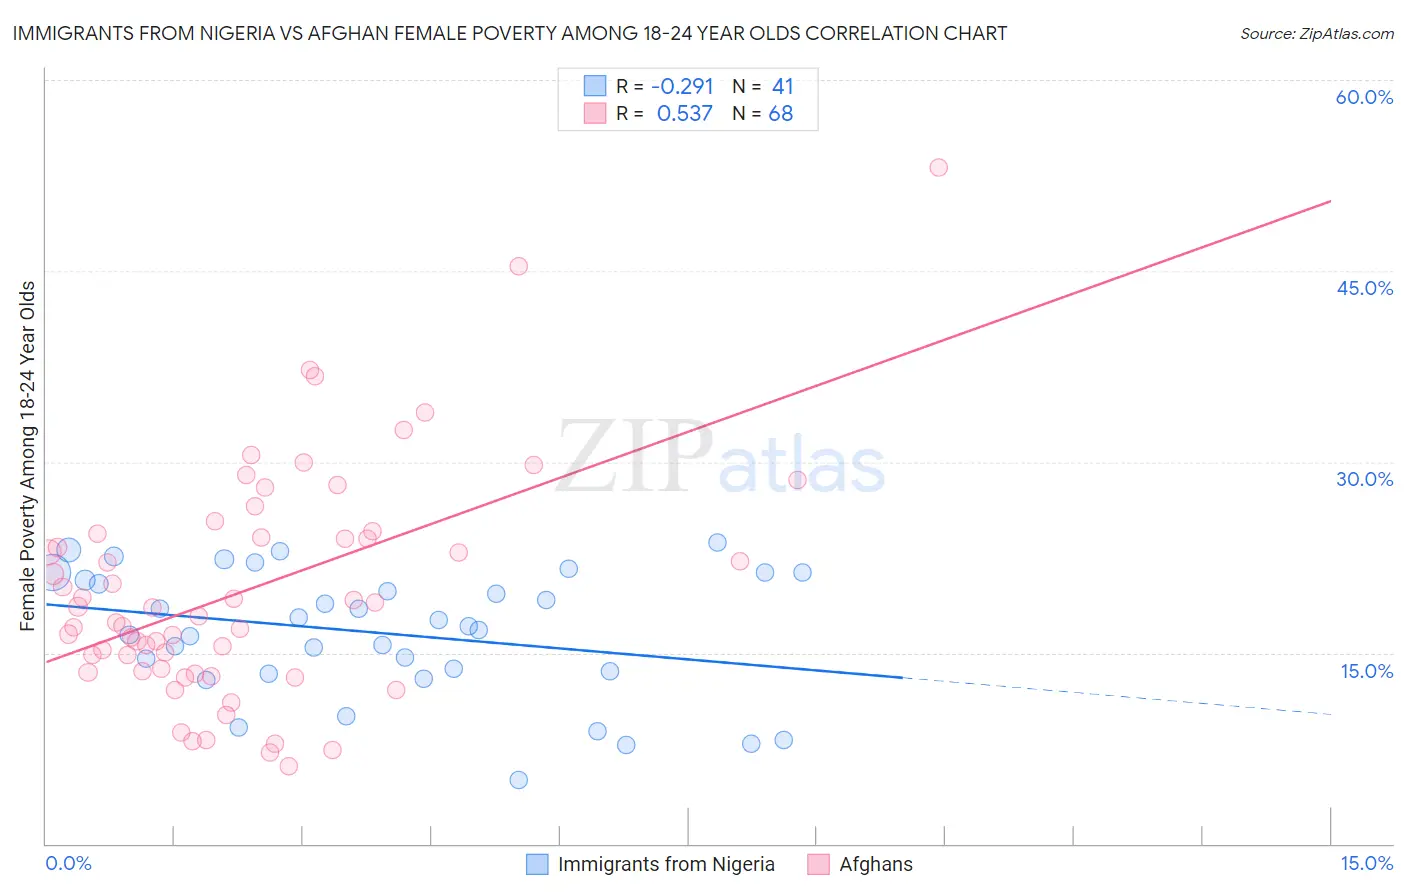
Immigrants from Nigeria vs Afghan Female Poverty Among 18-24 Year Olds Correlation Chart

The statistical analysis conducted on geographies consisting of 279,729,730 people shows a weak negative correlation between the proportion of Immigrants from Nigeria and poverty level among females between the ages 18 and 24 in the United States with a correlation coefficient (R) of -0.291 and weighted average of 20.1%. Similarly, the statistical analysis conducted on geographies consisting of 147,837,560 people shows a substantial positive correlation between the proportion of Afghans and poverty level among females between the ages 18 and 24 in the United States with a correlation coefficient (R) of 0.537 and weighted average of 19.0%, a difference of 5.8%.
Immigrants from Nigeria vs Afghan Female Poverty Among 18-24 Year Olds

Female Poverty Among 18-24 Year Olds Correlation Summary

MeasurementImmigrants from NigeriaAfghan
Minimum5.1%6.1%
Maximum23.7%53.1%
Range18.6%47.0%
Mean16.6%19.9%
Median17.1%18.2%
Interquartile 25% (IQ1)13.5%13.6%
Interquartile 75% (IQ3)21.0%24.2%
Interquartile Range (IQR)7.5%10.5%
Standard Deviation (Sample)5.0%9.0%
Standard Deviation (Population)4.9%8.9%

Similar Demographics by Female Poverty Among 18-24 Year Olds

Demographics Similar to Immigrants from Nigeria by Female Poverty Among 18-24 Year Olds

In terms of female poverty among 18-24 year olds, the demographic groups most similar to Immigrants from Nigeria are Iranian (20.1%, a difference of 0.020%), Hmong (20.0%, a difference of 0.060%), Belizean (20.1%, a difference of 0.11%), Irish (20.1%, a difference of 0.21%), and Swedish (20.1%, a difference of 0.21%).
DemographicsRating | RankFemale Poverty Among 18-24 Year Olds
Central Americans
70.0
/100
|
#164
Good
19.9%
Eastern Europeans
69.3
/100
|
#165
Good
19.9%
Belgians
69.1
/100
|
#166
Good
19.9%
Czechoslovakians
61.8
/100
|
#167
Good
20.0%
Fijians
59.1
/100
|
#168
Average
20.0%
Hmong
55.4
/100
|
#169
Average
20.0%
Iranians
54.7
/100
|
#170
Average
20.1%
Immigrants | Nigeria
54.3
/100
|
#171
Average
20.1%
Belizeans
52.0
/100
|
#172
Average
20.1%
Irish
50.0
/100
|
#173
Average
20.1%
Swedes
50.0
/100
|
#174
Average
20.1%
South American Indians
48.4
/100
|
#175
Average
20.1%
Kenyans
44.9
/100
|
#176
Average
20.2%
Immigrants | Kazakhstan
44.2
/100
|
#177
Average
20.2%
Swiss
44.0
/100
|
#178
Average
20.2%

Demographics Similar to Afghans by Female Poverty Among 18-24 Year Olds

In terms of female poverty among 18-24 year olds, the demographic groups most similar to Afghans are Immigrants from Cabo Verde (19.0%, a difference of 0.030%), Croatian (19.0%, a difference of 0.050%), Romanian (19.0%, a difference of 0.090%), Filipino (19.0%, a difference of 0.14%), and Haitian (19.0%, a difference of 0.17%).
DemographicsRating | RankFemale Poverty Among 18-24 Year Olds
Immigrants | Indonesia
99.4
/100
|
#83
Exceptional
18.9%
Burmese
99.2
/100
|
#84
Exceptional
18.9%
Immigrants | Armenia
99.2
/100
|
#85
Exceptional
18.9%
Immigrants | Iraq
99.2
/100
|
#86
Exceptional
18.9%
Immigrants | Jamaica
99.2
/100
|
#87
Exceptional
18.9%
Croatians
99.1
/100
|
#88
Exceptional
19.0%
Immigrants | Cabo Verde
99.0
/100
|
#89
Exceptional
19.0%
Afghans
99.0
/100
|
#90
Exceptional
19.0%
Romanians
98.9
/100
|
#91
Exceptional
19.0%
Filipinos
98.9
/100
|
#92
Exceptional
19.0%
Haitians
98.9
/100
|
#93
Exceptional
19.0%
Ukrainians
98.8
/100
|
#94
Exceptional
19.0%
Guamanians/Chamorros
98.8
/100
|
#95
Exceptional
19.0%
Sierra Leoneans
98.7
/100
|
#96
Exceptional
19.0%
Salvadorans
98.4
/100
|
#97
Exceptional
19.1%