Immigrants from Nicaragua vs Israeli Female Poverty Among 25-34 Year Olds
COMPARE
Immigrants from Nicaragua
Israeli
Female Poverty Among 25-34 Year Olds
Female Poverty Among 25-34 Year Olds Comparison
Immigrants from Nicaragua
Israelis
14.8%
FEMALE POVERTY AMONG 25-34 YEAR OLDS
1.1/ 100
METRIC RATING
243rd/ 347
METRIC RANK
13.1%
FEMALE POVERTY AMONG 25-34 YEAR OLDS
81.9/ 100
METRIC RATING
143rd/ 347
METRIC RANK
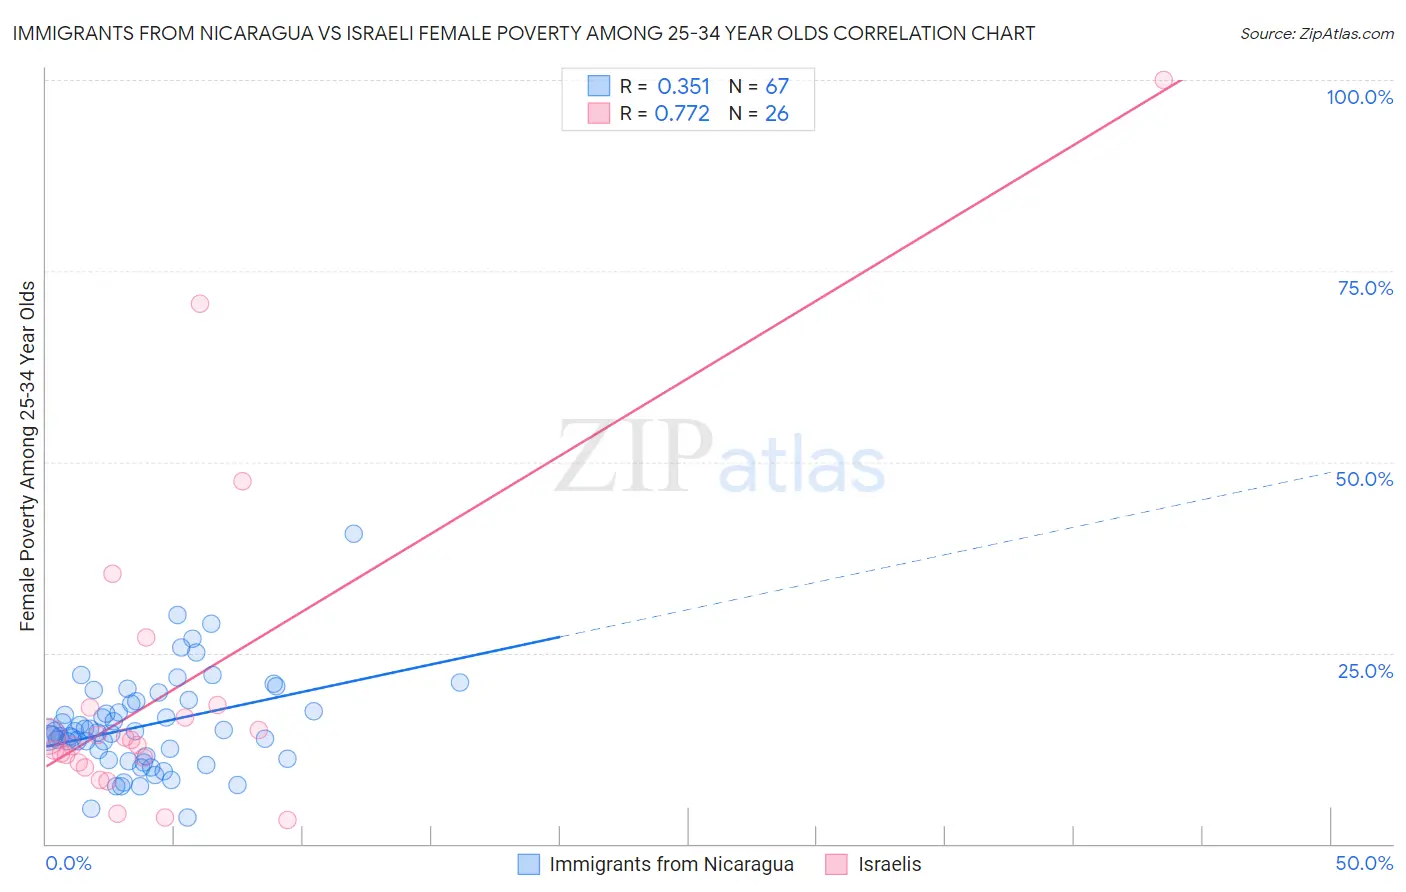
Immigrants from Nicaragua vs Israeli Female Poverty Among 25-34 Year Olds Correlation Chart
The statistical analysis conducted on geographies consisting of 235,106,985 people shows a mild positive correlation between the proportion of Immigrants from Nicaragua and poverty level among females between the ages 25 and 34 in the United States with a correlation coefficient (R) of 0.351 and weighted average of 14.8%. Similarly, the statistical analysis conducted on geographies consisting of 208,501,363 people shows a strong positive correlation between the proportion of Israelis and poverty level among females between the ages 25 and 34 in the United States with a correlation coefficient (R) of 0.772 and weighted average of 13.1%, a difference of 12.8%.
Female Poverty Among 25-34 Year Olds Correlation Summary
| Measurement | Immigrants from Nicaragua | Israeli |
| Minimum | 3.4% | 3.1% |
| Maximum | 40.6% | 100.0% |
| Range | 37.2% | 96.9% |
| Mean | 15.5% | 20.1% |
| Median | 14.5% | 13.3% |
| Interquartile 25% (IQ1) | 11.1% | 10.6% |
| Interquartile 75% (IQ3) | 18.6% | 17.8% |
| Interquartile Range (IQR) | 7.5% | 7.3% |
| Standard Deviation (Sample) | 6.3% | 21.8% |
| Standard Deviation (Population) | 6.2% | 21.4% |
Similar Demographics by Female Poverty Among 25-34 Year Olds
Demographics Similar to Immigrants from Nicaragua by Female Poverty Among 25-34 Year Olds
In terms of female poverty among 25-34 year olds, the demographic groups most similar to Immigrants from Nicaragua are Immigrants from Bangladesh (14.8%, a difference of 0.010%), Scotch-Irish (14.8%, a difference of 0.040%), Barbadian (14.8%, a difference of 0.040%), Immigrants from Middle Africa (14.8%, a difference of 0.19%), and Jamaican (14.8%, a difference of 0.22%).
| Demographics | Rating | Rank | Female Poverty Among 25-34 Year Olds |
| Salvadorans | 1.4 /100 | #236 | Tragic 14.7% |
| Immigrants | Ghana | 1.4 /100 | #237 | Tragic 14.7% |
| Alsatians | 1.4 /100 | #238 | Tragic 14.7% |
| Malaysians | 1.4 /100 | #239 | Tragic 14.7% |
| Immigrants | Grenada | 1.3 /100 | #240 | Tragic 14.7% |
| Scotch-Irish | 1.2 /100 | #241 | Tragic 14.8% |
| Barbadians | 1.2 /100 | #242 | Tragic 14.8% |
| Immigrants | Nicaragua | 1.1 /100 | #243 | Tragic 14.8% |
| Immigrants | Bangladesh | 1.1 /100 | #244 | Tragic 14.8% |
| Immigrants | Middle Africa | 1.0 /100 | #245 | Tragic 14.8% |
| Jamaicans | 1.0 /100 | #246 | Tragic 14.8% |
| German Russians | 0.8 /100 | #247 | Tragic 14.9% |
| Immigrants | Western Africa | 0.8 /100 | #248 | Tragic 14.9% |
| Immigrants | Haiti | 0.5 /100 | #249 | Tragic 15.0% |
| Immigrants | El Salvador | 0.5 /100 | #250 | Tragic 15.0% |
Demographics Similar to Israelis by Female Poverty Among 25-34 Year Olds
In terms of female poverty among 25-34 year olds, the demographic groups most similar to Israelis are Scandinavian (13.1%, a difference of 0.060%), New Zealander (13.1%, a difference of 0.22%), Immigrants from Iraq (13.1%, a difference of 0.26%), Austrian (13.1%, a difference of 0.28%), and Brazilian (13.1%, a difference of 0.40%).
| Demographics | Rating | Rank | Female Poverty Among 25-34 Year Olds |
| Immigrants | England | 85.5 /100 | #136 | Excellent 13.0% |
| Immigrants | Chile | 84.6 /100 | #137 | Excellent 13.1% |
| Brazilians | 84.5 /100 | #138 | Excellent 13.1% |
| Austrians | 83.7 /100 | #139 | Excellent 13.1% |
| Immigrants | Iraq | 83.6 /100 | #140 | Excellent 13.1% |
| New Zealanders | 83.4 /100 | #141 | Excellent 13.1% |
| Scandinavians | 82.3 /100 | #142 | Excellent 13.1% |
| Israelis | 81.9 /100 | #143 | Excellent 13.1% |
| Native Hawaiians | 78.9 /100 | #144 | Good 13.2% |
| Colombians | 77.2 /100 | #145 | Good 13.2% |
| South Americans | 76.9 /100 | #146 | Good 13.2% |
| Europeans | 76.8 /100 | #147 | Good 13.2% |
| Lebanese | 76.8 /100 | #148 | Good 13.2% |
| Sierra Leoneans | 76.3 /100 | #149 | Good 13.2% |
| Iraqis | 76.0 /100 | #150 | Good 13.2% |