Immigrants from Guatemala vs Israeli Female Poverty Among 25-34 Year Olds
COMPARE
Immigrants from Guatemala
Israeli
Female Poverty Among 25-34 Year Olds
Female Poverty Among 25-34 Year Olds Comparison
Immigrants from Guatemala
Israelis
16.6%
FEMALE POVERTY AMONG 25-34 YEAR OLDS
0.0/ 100
METRIC RATING
297th/ 347
METRIC RANK
13.1%
FEMALE POVERTY AMONG 25-34 YEAR OLDS
81.9/ 100
METRIC RATING
143rd/ 347
METRIC RANK
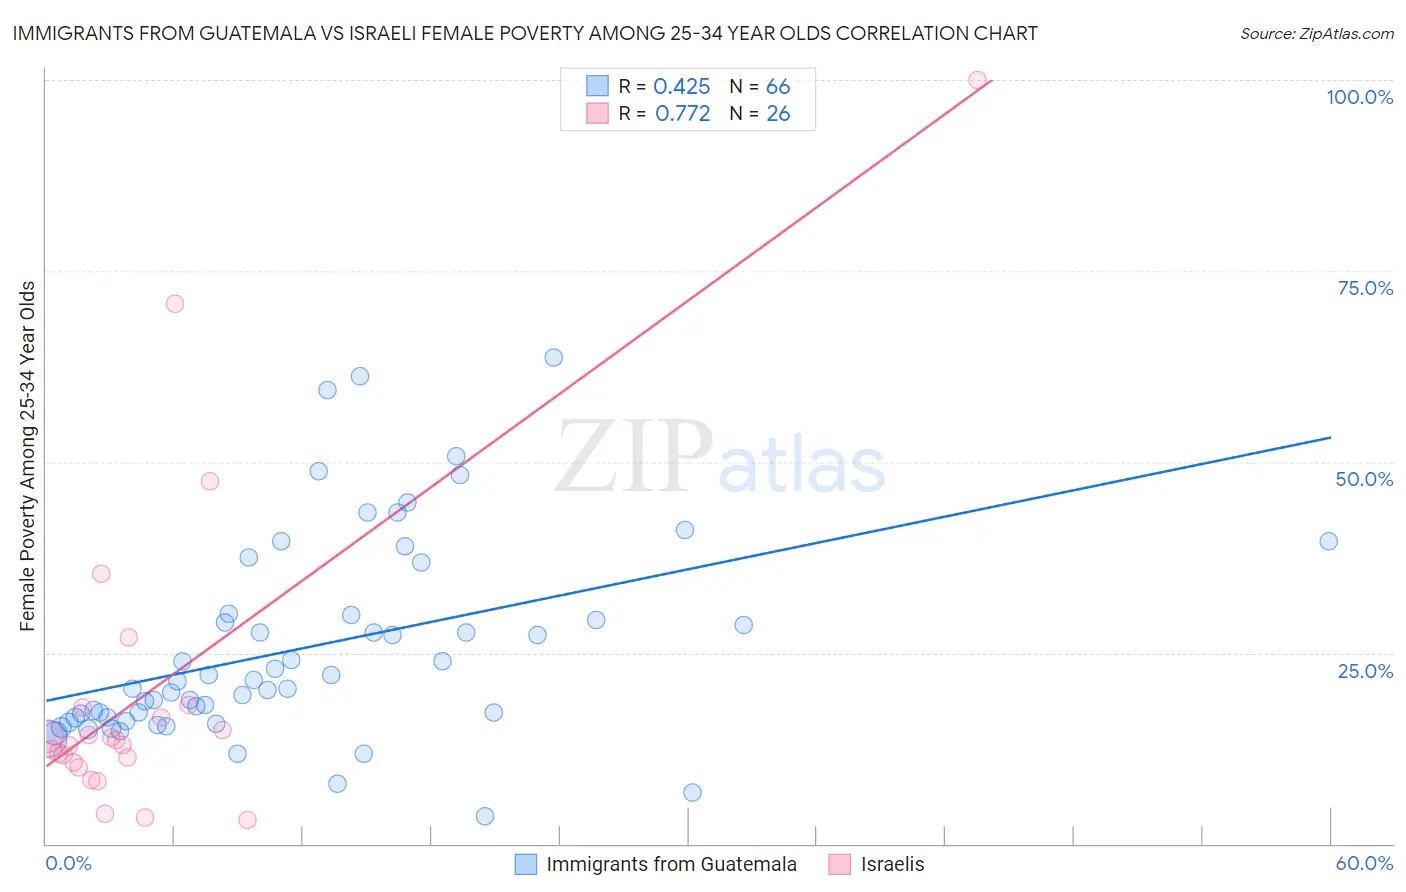
Immigrants from Guatemala vs Israeli Female Poverty Among 25-34 Year Olds Correlation Chart
The statistical analysis conducted on geographies consisting of 373,350,346 people shows a moderate positive correlation between the proportion of Immigrants from Guatemala and poverty level among females between the ages 25 and 34 in the United States with a correlation coefficient (R) of 0.425 and weighted average of 16.6%. Similarly, the statistical analysis conducted on geographies consisting of 208,501,363 people shows a strong positive correlation between the proportion of Israelis and poverty level among females between the ages 25 and 34 in the United States with a correlation coefficient (R) of 0.772 and weighted average of 13.1%, a difference of 26.9%.
Female Poverty Among 25-34 Year Olds Correlation Summary
| Measurement | Immigrants from Guatemala | Israeli |
| Minimum | 3.7% | 3.1% |
| Maximum | 63.6% | 100.0% |
| Range | 60.0% | 96.9% |
| Mean | 25.5% | 20.1% |
| Median | 20.8% | 13.3% |
| Interquartile 25% (IQ1) | 16.5% | 10.6% |
| Interquartile 75% (IQ3) | 30.0% | 17.8% |
| Interquartile Range (IQR) | 13.5% | 7.3% |
| Standard Deviation (Sample) | 13.3% | 21.8% |
| Standard Deviation (Population) | 13.2% | 21.4% |
Similar Demographics by Female Poverty Among 25-34 Year Olds
Demographics Similar to Immigrants from Guatemala by Female Poverty Among 25-34 Year Olds
In terms of female poverty among 25-34 year olds, the demographic groups most similar to Immigrants from Guatemala are Hispanic or Latino (16.6%, a difference of 0.060%), Mexican (16.6%, a difference of 0.26%), Immigrants from Central America (16.6%, a difference of 0.33%), Blackfeet (16.7%, a difference of 0.51%), and Spanish American (16.7%, a difference of 0.55%).
| Demographics | Rating | Rank | Female Poverty Among 25-34 Year Olds |
| Indonesians | 0.0 /100 | #290 | Tragic 16.4% |
| Comanche | 0.0 /100 | #291 | Tragic 16.5% |
| Immigrants | Dominica | 0.0 /100 | #292 | Tragic 16.5% |
| Potawatomi | 0.0 /100 | #293 | Tragic 16.5% |
| Immigrants | Central America | 0.0 /100 | #294 | Tragic 16.6% |
| Mexicans | 0.0 /100 | #295 | Tragic 16.6% |
| Hispanics or Latinos | 0.0 /100 | #296 | Tragic 16.6% |
| Immigrants | Guatemala | 0.0 /100 | #297 | Tragic 16.6% |
| Blackfeet | 0.0 /100 | #298 | Tragic 16.7% |
| Spanish Americans | 0.0 /100 | #299 | Tragic 16.7% |
| U.S. Virgin Islanders | 0.0 /100 | #300 | Tragic 16.7% |
| Immigrants | Congo | 0.0 /100 | #301 | Tragic 16.7% |
| Alaska Natives | 0.0 /100 | #302 | Tragic 16.8% |
| Immigrants | Mexico | 0.0 /100 | #303 | Tragic 16.8% |
| Hondurans | 0.0 /100 | #304 | Tragic 16.9% |
Demographics Similar to Israelis by Female Poverty Among 25-34 Year Olds
In terms of female poverty among 25-34 year olds, the demographic groups most similar to Israelis are Scandinavian (13.1%, a difference of 0.060%), New Zealander (13.1%, a difference of 0.22%), Immigrants from Iraq (13.1%, a difference of 0.26%), Austrian (13.1%, a difference of 0.28%), and Brazilian (13.1%, a difference of 0.40%).
| Demographics | Rating | Rank | Female Poverty Among 25-34 Year Olds |
| Immigrants | England | 85.5 /100 | #136 | Excellent 13.0% |
| Immigrants | Chile | 84.6 /100 | #137 | Excellent 13.1% |
| Brazilians | 84.5 /100 | #138 | Excellent 13.1% |
| Austrians | 83.7 /100 | #139 | Excellent 13.1% |
| Immigrants | Iraq | 83.6 /100 | #140 | Excellent 13.1% |
| New Zealanders | 83.4 /100 | #141 | Excellent 13.1% |
| Scandinavians | 82.3 /100 | #142 | Excellent 13.1% |
| Israelis | 81.9 /100 | #143 | Excellent 13.1% |
| Native Hawaiians | 78.9 /100 | #144 | Good 13.2% |
| Colombians | 77.2 /100 | #145 | Good 13.2% |
| South Americans | 76.9 /100 | #146 | Good 13.2% |
| Europeans | 76.8 /100 | #147 | Good 13.2% |
| Lebanese | 76.8 /100 | #148 | Good 13.2% |
| Sierra Leoneans | 76.3 /100 | #149 | Good 13.2% |
| Iraqis | 76.0 /100 | #150 | Good 13.2% |