Immigrants from Nicaragua vs French Poverty
COMPARE
Immigrants from Nicaragua
French
Poverty
Poverty Comparison
Immigrants from Nicaragua
French
14.3%
POVERTY
0.1/ 100
METRIC RATING
259th/ 347
METRIC RANK
11.8%
POVERTY
86.1/ 100
METRIC RATING
131st/ 347
METRIC RANK
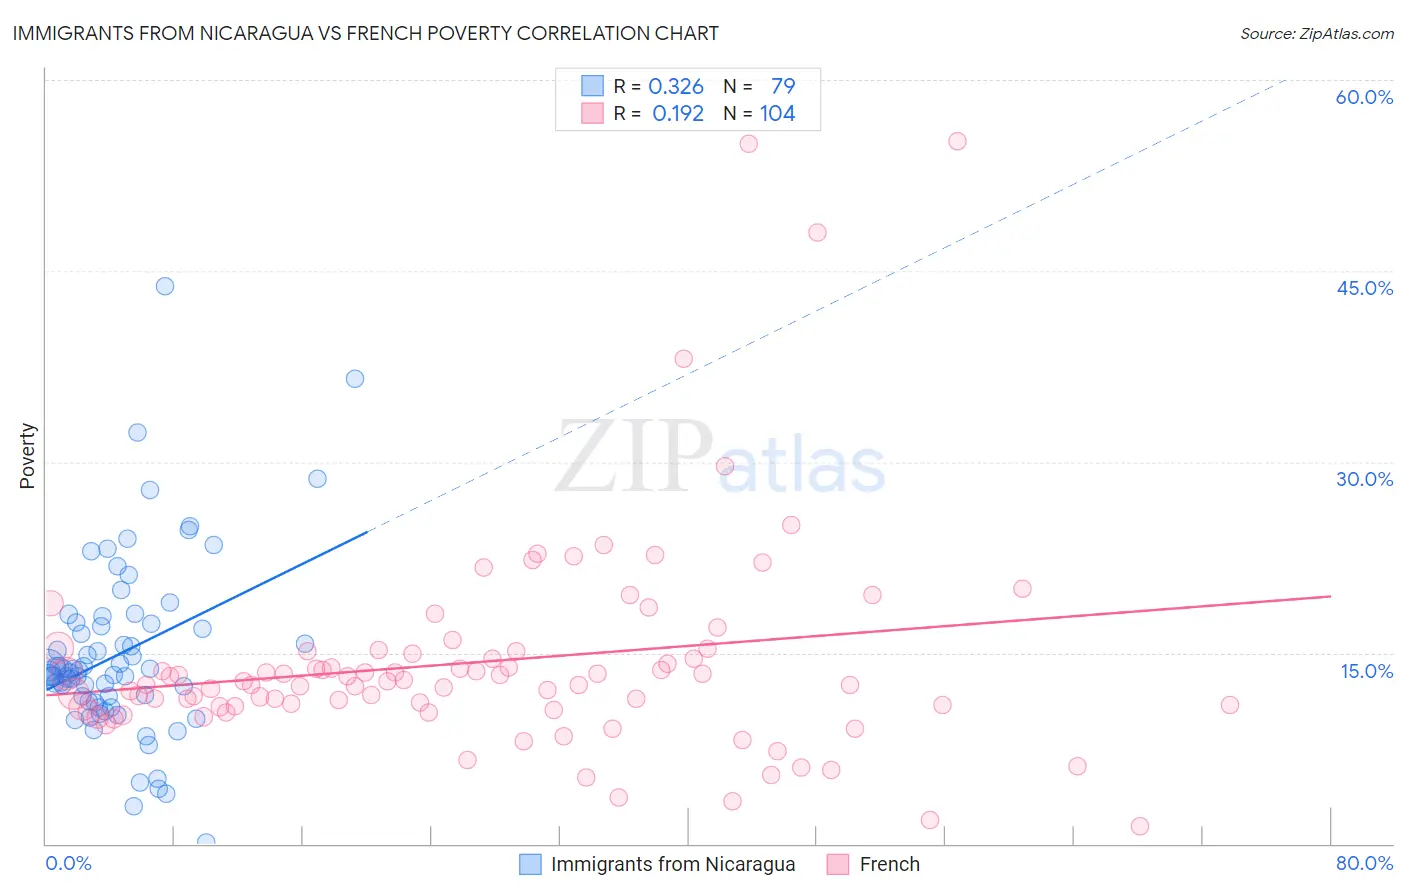
Immigrants from Nicaragua vs French Poverty Correlation Chart
The statistical analysis conducted on geographies consisting of 236,320,114 people shows a mild positive correlation between the proportion of Immigrants from Nicaragua and poverty level in the United States with a correlation coefficient (R) of 0.326 and weighted average of 14.3%. Similarly, the statistical analysis conducted on geographies consisting of 571,552,605 people shows a poor positive correlation between the proportion of French and poverty level in the United States with a correlation coefficient (R) of 0.192 and weighted average of 11.8%, a difference of 21.8%.
Poverty Correlation Summary
| Measurement | Immigrants from Nicaragua | French |
| Minimum | 0.098% | 1.4% |
| Maximum | 43.8% | 55.2% |
| Range | 43.7% | 53.8% |
| Mean | 14.9% | 14.3% |
| Median | 13.6% | 12.6% |
| Interquartile 25% (IQ1) | 11.2% | 10.7% |
| Interquartile 75% (IQ3) | 17.3% | 15.0% |
| Interquartile Range (IQR) | 6.1% | 4.3% |
| Standard Deviation (Sample) | 7.1% | 8.6% |
| Standard Deviation (Population) | 7.0% | 8.5% |
Similar Demographics by Poverty
Demographics Similar to Immigrants from Nicaragua by Poverty
In terms of poverty, the demographic groups most similar to Immigrants from Nicaragua are Cape Verdean (14.4%, a difference of 0.080%), Cherokee (14.4%, a difference of 0.10%), Immigrants from Liberia (14.4%, a difference of 0.26%), Ottawa (14.3%, a difference of 0.27%), and Trinidadian and Tobagonian (14.3%, a difference of 0.28%).
| Demographics | Rating | Rank | Poverty |
| Spanish American Indians | 0.2 /100 | #252 | Tragic 14.2% |
| Immigrants | Trinidad and Tobago | 0.2 /100 | #253 | Tragic 14.2% |
| Immigrants | El Salvador | 0.1 /100 | #254 | Tragic 14.3% |
| Immigrants | Ecuador | 0.1 /100 | #255 | Tragic 14.3% |
| Mexican American Indians | 0.1 /100 | #256 | Tragic 14.3% |
| Trinidadians and Tobagonians | 0.1 /100 | #257 | Tragic 14.3% |
| Ottawa | 0.1 /100 | #258 | Tragic 14.3% |
| Immigrants | Nicaragua | 0.1 /100 | #259 | Tragic 14.3% |
| Cape Verdeans | 0.1 /100 | #260 | Tragic 14.4% |
| Cherokee | 0.1 /100 | #261 | Tragic 14.4% |
| Immigrants | Liberia | 0.1 /100 | #262 | Tragic 14.4% |
| Jamaicans | 0.1 /100 | #263 | Tragic 14.4% |
| Immigrants | Jamaica | 0.1 /100 | #264 | Tragic 14.4% |
| Immigrants | Guyana | 0.1 /100 | #265 | Tragic 14.5% |
| Guyanese | 0.1 /100 | #266 | Tragic 14.5% |
Demographics Similar to French by Poverty
In terms of poverty, the demographic groups most similar to French are Immigrants from Ukraine (11.8%, a difference of 0.10%), Peruvian (11.8%, a difference of 0.11%), South African (11.7%, a difference of 0.19%), Immigrants from Western Europe (11.8%, a difference of 0.19%), and Yugoslavian (11.8%, a difference of 0.19%).
| Demographics | Rating | Rank | Poverty |
| Soviet Union | 88.4 /100 | #124 | Excellent 11.7% |
| Immigrants | Brazil | 88.2 /100 | #125 | Excellent 11.7% |
| Immigrants | Norway | 88.0 /100 | #126 | Excellent 11.7% |
| Immigrants | Argentina | 88.0 /100 | #127 | Excellent 11.7% |
| Immigrants | Israel | 87.4 /100 | #128 | Excellent 11.7% |
| South Africans | 87.0 /100 | #129 | Excellent 11.7% |
| Immigrants | Ukraine | 86.6 /100 | #130 | Excellent 11.8% |
| French | 86.1 /100 | #131 | Excellent 11.8% |
| Peruvians | 85.6 /100 | #132 | Excellent 11.8% |
| Immigrants | Western Europe | 85.2 /100 | #133 | Excellent 11.8% |
| Yugoslavians | 85.2 /100 | #134 | Excellent 11.8% |
| Immigrants | Vietnam | 85.2 /100 | #135 | Excellent 11.8% |
| Chileans | 84.2 /100 | #136 | Excellent 11.8% |
| Immigrants | Switzerland | 83.0 /100 | #137 | Excellent 11.8% |
| Immigrants | Jordan | 82.4 /100 | #138 | Excellent 11.9% |