Immigrants from Eastern Asia vs French Poverty
COMPARE
Immigrants from Eastern Asia
French
Poverty
Poverty Comparison
Immigrants from Eastern Asia
French
11.3%
POVERTY
96.7/ 100
METRIC RATING
77th/ 347
METRIC RANK
11.8%
POVERTY
86.1/ 100
METRIC RATING
131st/ 347
METRIC RANK
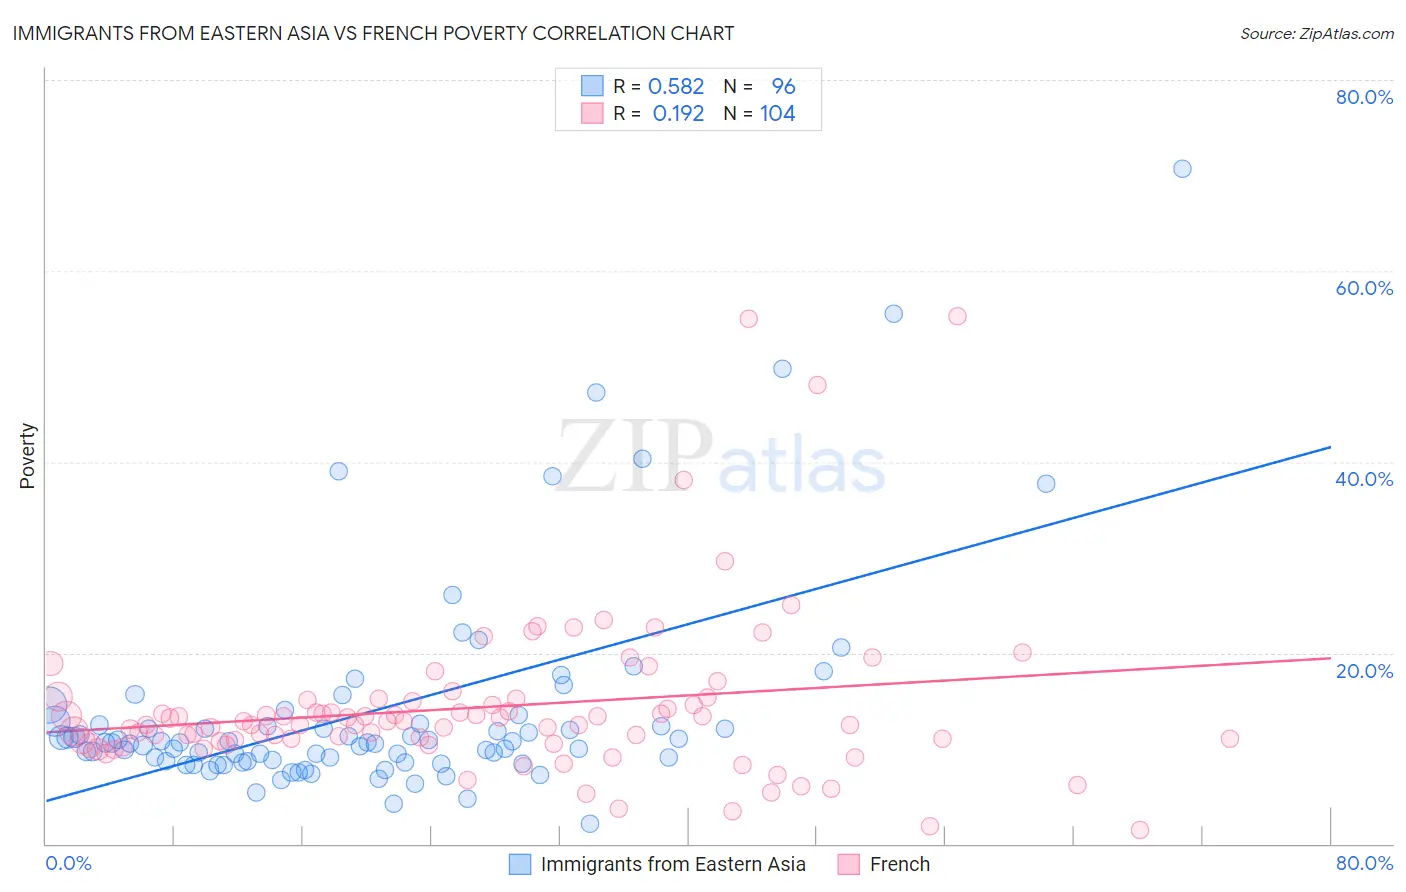
Immigrants from Eastern Asia vs French Poverty Correlation Chart
The statistical analysis conducted on geographies consisting of 499,367,398 people shows a substantial positive correlation between the proportion of Immigrants from Eastern Asia and poverty level in the United States with a correlation coefficient (R) of 0.582 and weighted average of 11.3%. Similarly, the statistical analysis conducted on geographies consisting of 571,552,605 people shows a poor positive correlation between the proportion of French and poverty level in the United States with a correlation coefficient (R) of 0.192 and weighted average of 11.8%, a difference of 4.1%.
Poverty Correlation Summary
| Measurement | Immigrants from Eastern Asia | French |
| Minimum | 2.1% | 1.4% |
| Maximum | 70.7% | 55.2% |
| Range | 68.7% | 53.8% |
| Mean | 13.9% | 14.3% |
| Median | 10.6% | 12.6% |
| Interquartile 25% (IQ1) | 8.6% | 10.7% |
| Interquartile 75% (IQ3) | 12.5% | 15.0% |
| Interquartile Range (IQR) | 3.8% | 4.3% |
| Standard Deviation (Sample) | 11.2% | 8.6% |
| Standard Deviation (Population) | 11.2% | 8.5% |
Similar Demographics by Poverty
Demographics Similar to Immigrants from Eastern Asia by Poverty
In terms of poverty, the demographic groups most similar to Immigrants from Eastern Asia are Dutch (11.3%, a difference of 0.010%), Cambodian (11.3%, a difference of 0.060%), Immigrants from North America (11.3%, a difference of 0.070%), Indian (Asian) (11.3%, a difference of 0.080%), and Irish (11.3%, a difference of 0.080%).
| Demographics | Rating | Rank | Poverty |
| Immigrants | Canada | 97.3 /100 | #70 | Exceptional 11.3% |
| Zimbabweans | 97.3 /100 | #71 | Exceptional 11.3% |
| Europeans | 97.2 /100 | #72 | Exceptional 11.3% |
| Immigrants | Belgium | 97.2 /100 | #73 | Exceptional 11.3% |
| Carpatho Rusyns | 97.2 /100 | #74 | Exceptional 11.3% |
| Immigrants | Eastern Europe | 97.0 /100 | #75 | Exceptional 11.3% |
| Immigrants | North America | 96.8 /100 | #76 | Exceptional 11.3% |
| Immigrants | Eastern Asia | 96.7 /100 | #77 | Exceptional 11.3% |
| Dutch | 96.7 /100 | #78 | Exceptional 11.3% |
| Cambodians | 96.7 /100 | #79 | Exceptional 11.3% |
| Indians (Asian) | 96.6 /100 | #80 | Exceptional 11.3% |
| Irish | 96.6 /100 | #81 | Exceptional 11.3% |
| Egyptians | 96.5 /100 | #82 | Exceptional 11.3% |
| Immigrants | Sweden | 96.3 /100 | #83 | Exceptional 11.3% |
| English | 96.3 /100 | #84 | Exceptional 11.3% |
Demographics Similar to French by Poverty
In terms of poverty, the demographic groups most similar to French are Immigrants from Ukraine (11.8%, a difference of 0.10%), Peruvian (11.8%, a difference of 0.11%), South African (11.7%, a difference of 0.19%), Immigrants from Western Europe (11.8%, a difference of 0.19%), and Yugoslavian (11.8%, a difference of 0.19%).
| Demographics | Rating | Rank | Poverty |
| Soviet Union | 88.4 /100 | #124 | Excellent 11.7% |
| Immigrants | Brazil | 88.2 /100 | #125 | Excellent 11.7% |
| Immigrants | Norway | 88.0 /100 | #126 | Excellent 11.7% |
| Immigrants | Argentina | 88.0 /100 | #127 | Excellent 11.7% |
| Immigrants | Israel | 87.4 /100 | #128 | Excellent 11.7% |
| South Africans | 87.0 /100 | #129 | Excellent 11.7% |
| Immigrants | Ukraine | 86.6 /100 | #130 | Excellent 11.8% |
| French | 86.1 /100 | #131 | Excellent 11.8% |
| Peruvians | 85.6 /100 | #132 | Excellent 11.8% |
| Immigrants | Western Europe | 85.2 /100 | #133 | Excellent 11.8% |
| Yugoslavians | 85.2 /100 | #134 | Excellent 11.8% |
| Immigrants | Vietnam | 85.2 /100 | #135 | Excellent 11.8% |
| Chileans | 84.2 /100 | #136 | Excellent 11.8% |
| Immigrants | Switzerland | 83.0 /100 | #137 | Excellent 11.8% |
| Immigrants | Jordan | 82.4 /100 | #138 | Excellent 11.9% |