Immigrants from Nicaragua vs Alaska Native Seniors Poverty Over the Age of 65
COMPARE
Immigrants from Nicaragua
Alaska Native
Seniors Poverty Over the Age of 65
Seniors Poverty Over the Age of 65 Comparison
Immigrants from Nicaragua
Alaska Natives
15.9%
SENIORS POVERTY OVER THE AGE OF 65
0.0/ 100
METRIC RATING
334th/ 347
METRIC RANK
10.8%
SENIORS POVERTY OVER THE AGE OF 65
60.3/ 100
METRIC RATING
167th/ 347
METRIC RANK
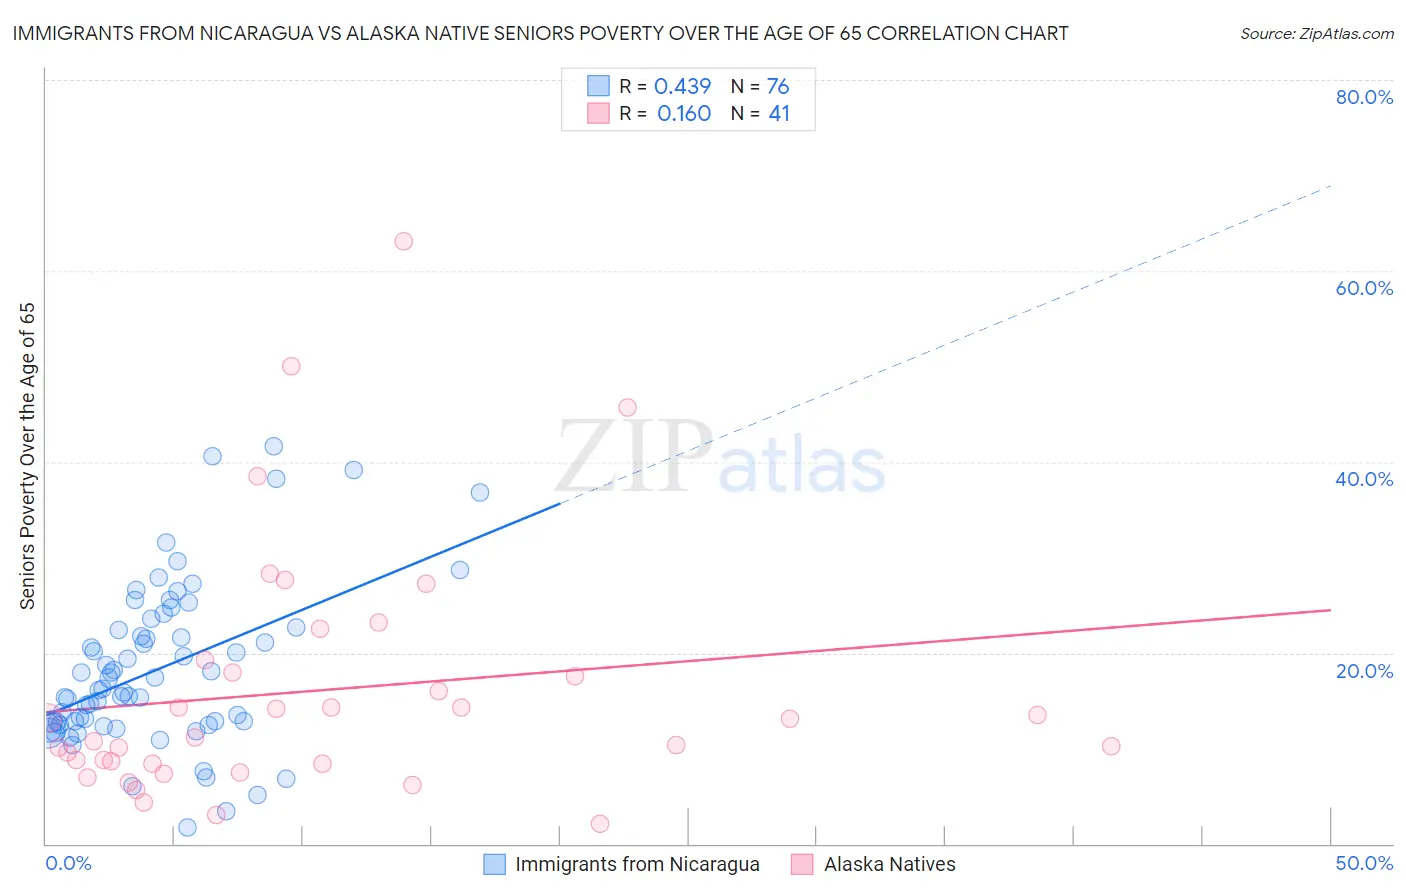
Immigrants from Nicaragua vs Alaska Native Seniors Poverty Over the Age of 65 Correlation Chart
The statistical analysis conducted on geographies consisting of 236,090,448 people shows a moderate positive correlation between the proportion of Immigrants from Nicaragua and poverty level among seniors over the age of 65 in the United States with a correlation coefficient (R) of 0.439 and weighted average of 15.9%. Similarly, the statistical analysis conducted on geographies consisting of 76,614,353 people shows a poor positive correlation between the proportion of Alaska Natives and poverty level among seniors over the age of 65 in the United States with a correlation coefficient (R) of 0.160 and weighted average of 10.8%, a difference of 46.8%.
Seniors Poverty Over the Age of 65 Correlation Summary
| Measurement | Immigrants from Nicaragua | Alaska Native |
| Minimum | 1.7% | 2.0% |
| Maximum | 41.6% | 63.2% |
| Range | 39.9% | 61.1% |
| Mean | 18.2% | 16.1% |
| Median | 16.2% | 11.1% |
| Interquartile 25% (IQ1) | 12.6% | 8.4% |
| Interquartile 75% (IQ3) | 22.5% | 18.6% |
| Interquartile Range (IQR) | 9.9% | 10.2% |
| Standard Deviation (Sample) | 8.5% | 13.1% |
| Standard Deviation (Population) | 8.4% | 12.9% |
Similar Demographics by Seniors Poverty Over the Age of 65
Demographics Similar to Immigrants from Nicaragua by Seniors Poverty Over the Age of 65
In terms of seniors poverty over the age of 65, the demographic groups most similar to Immigrants from Nicaragua are Immigrants from Yemen (15.9%, a difference of 0.15%), Immigrants from Grenada (15.8%, a difference of 0.58%), Cuban (16.1%, a difference of 1.3%), Immigrants from Cabo Verde (16.2%, a difference of 1.8%), and British West Indian (15.6%, a difference of 2.0%).
| Demographics | Rating | Rank | Seniors Poverty Over the Age of 65 |
| Crow | 0.0 /100 | #327 | Tragic 15.2% |
| Sioux | 0.0 /100 | #328 | Tragic 15.3% |
| Immigrants | Dominica | 0.0 /100 | #329 | Tragic 15.5% |
| Immigrants | St. Vincent and the Grenadines | 0.0 /100 | #330 | Tragic 15.5% |
| British West Indians | 0.0 /100 | #331 | Tragic 15.6% |
| Immigrants | Grenada | 0.0 /100 | #332 | Tragic 15.8% |
| Immigrants | Yemen | 0.0 /100 | #333 | Tragic 15.9% |
| Immigrants | Nicaragua | 0.0 /100 | #334 | Tragic 15.9% |
| Cubans | 0.0 /100 | #335 | Tragic 16.1% |
| Immigrants | Cabo Verde | 0.0 /100 | #336 | Tragic 16.2% |
| Immigrants | Caribbean | 0.0 /100 | #337 | Tragic 16.5% |
| Pueblo | 0.0 /100 | #338 | Tragic 17.2% |
| Navajo | 0.0 /100 | #339 | Tragic 17.5% |
| Hopi | 0.0 /100 | #340 | Tragic 17.8% |
| Dominicans | 0.0 /100 | #341 | Tragic 17.8% |
Demographics Similar to Alaska Natives by Seniors Poverty Over the Age of 65
In terms of seniors poverty over the age of 65, the demographic groups most similar to Alaska Natives are Malaysian (10.8%, a difference of 0.16%), Immigrants from South Eastern Asia (10.8%, a difference of 0.17%), Potawatomi (10.8%, a difference of 0.22%), Mongolian (10.9%, a difference of 0.22%), and Sri Lankan (10.9%, a difference of 0.32%).
| Demographics | Rating | Rank | Seniors Poverty Over the Age of 65 |
| Sudanese | 68.2 /100 | #160 | Good 10.7% |
| Arabs | 65.2 /100 | #161 | Good 10.8% |
| Immigrants | Indonesia | 64.8 /100 | #162 | Good 10.8% |
| Tsimshian | 64.5 /100 | #163 | Good 10.8% |
| Potawatomi | 62.6 /100 | #164 | Good 10.8% |
| Immigrants | South Eastern Asia | 62.1 /100 | #165 | Good 10.8% |
| Malaysians | 62.0 /100 | #166 | Good 10.8% |
| Alaska Natives | 60.3 /100 | #167 | Good 10.8% |
| Mongolians | 58.0 /100 | #168 | Average 10.9% |
| Sri Lankans | 56.8 /100 | #169 | Average 10.9% |
| Immigrants | Eastern Europe | 55.8 /100 | #170 | Average 10.9% |
| Immigrants | Nonimmigrants | 55.1 /100 | #171 | Average 10.9% |
| Immigrants | Syria | 54.7 /100 | #172 | Average 10.9% |
| Spaniards | 50.7 /100 | #173 | Average 10.9% |
| Immigrants | Sudan | 50.0 /100 | #174 | Average 10.9% |