Immigrants from Netherlands vs Immigrants from Guyana Seniors Poverty Over the Age of 65
COMPARE
Immigrants from Netherlands
Immigrants from Guyana
Seniors Poverty Over the Age of 65
Seniors Poverty Over the Age of 65 Comparison
Immigrants from Netherlands
Immigrants from Guyana
9.9%
SENIORS POVERTY OVER THE AGE OF 65
98.7/ 100
METRIC RATING
66th/ 347
METRIC RANK
14.5%
SENIORS POVERTY OVER THE AGE OF 65
0.0/ 100
METRIC RATING
316th/ 347
METRIC RANK
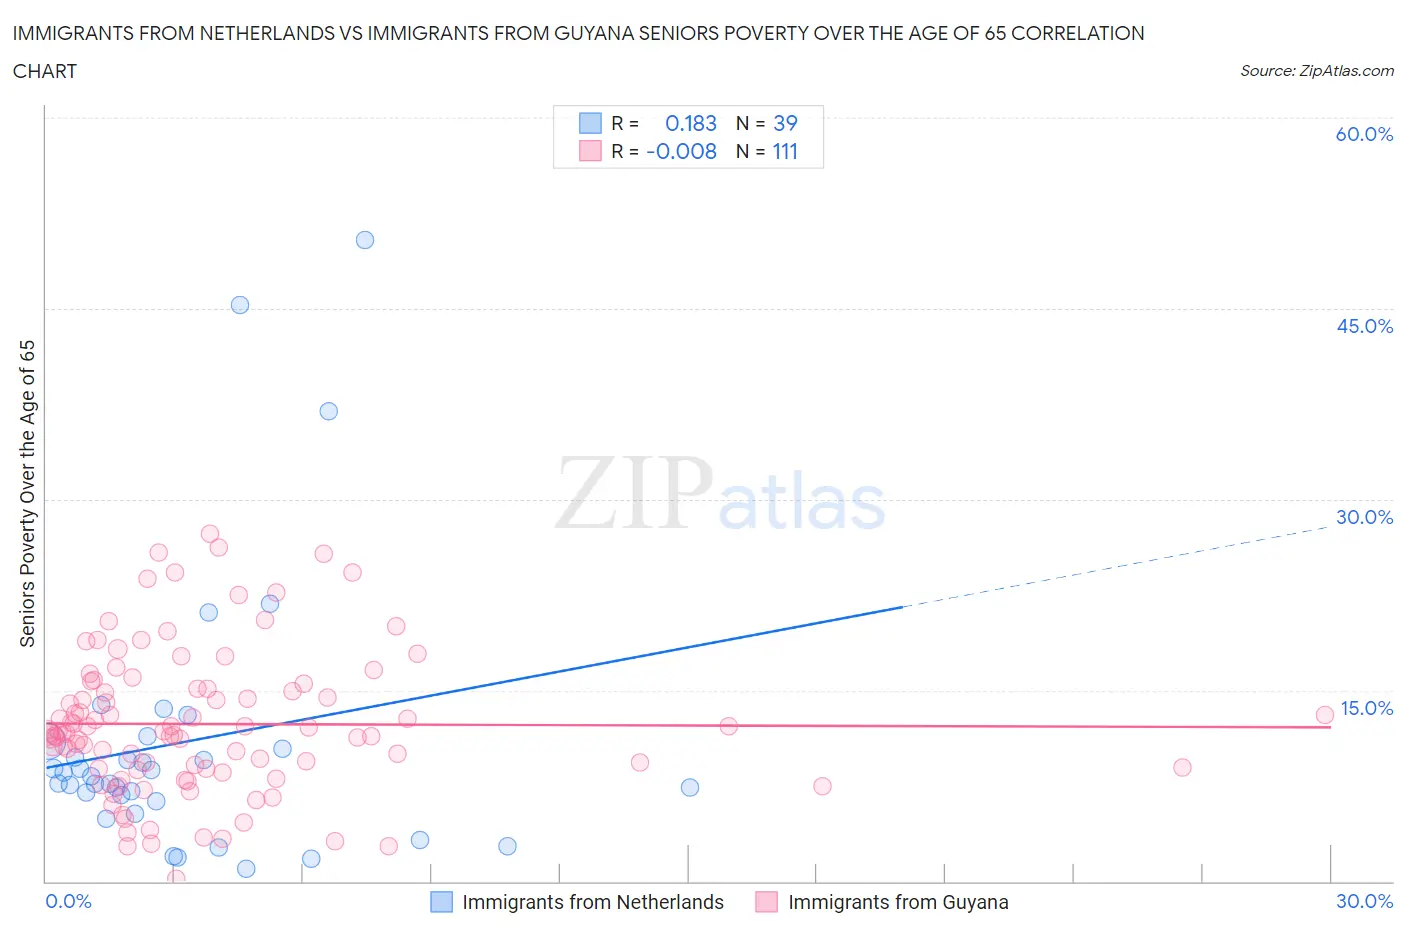
Immigrants from Netherlands vs Immigrants from Guyana Seniors Poverty Over the Age of 65 Correlation Chart
The statistical analysis conducted on geographies consisting of 237,542,922 people shows a poor positive correlation between the proportion of Immigrants from Netherlands and poverty level among seniors over the age of 65 in the United States with a correlation coefficient (R) of 0.183 and weighted average of 9.9%. Similarly, the statistical analysis conducted on geographies consisting of 183,396,619 people shows no correlation between the proportion of Immigrants from Guyana and poverty level among seniors over the age of 65 in the United States with a correlation coefficient (R) of -0.008 and weighted average of 14.5%, a difference of 46.2%.
Seniors Poverty Over the Age of 65 Correlation Summary
| Measurement | Immigrants from Netherlands | Immigrants from Guyana |
| Minimum | 1.0% | 0.21% |
| Maximum | 50.3% | 27.3% |
| Range | 49.3% | 27.1% |
| Mean | 11.0% | 12.3% |
| Median | 8.2% | 11.7% |
| Interquartile 25% (IQ1) | 6.3% | 8.8% |
| Interquartile 75% (IQ3) | 11.0% | 15.2% |
| Interquartile Range (IQR) | 4.8% | 6.4% |
| Standard Deviation (Sample) | 10.8% | 5.7% |
| Standard Deviation (Population) | 10.7% | 5.6% |
Similar Demographics by Seniors Poverty Over the Age of 65
Demographics Similar to Immigrants from Netherlands by Seniors Poverty Over the Age of 65
In terms of seniors poverty over the age of 65, the demographic groups most similar to Immigrants from Netherlands are Pennsylvania German (9.9%, a difference of 0.050%), Immigrants from Austria (9.9%, a difference of 0.10%), Canadian (9.9%, a difference of 0.32%), Immigrants from North America (9.9%, a difference of 0.33%), and Macedonian (9.9%, a difference of 0.38%).
| Demographics | Rating | Rank | Seniors Poverty Over the Age of 65 |
| Immigrants | Canada | 99.0 /100 | #59 | Exceptional 9.8% |
| Celtics | 99.0 /100 | #60 | Exceptional 9.8% |
| Iranians | 98.9 /100 | #61 | Exceptional 9.8% |
| French Canadians | 98.9 /100 | #62 | Exceptional 9.8% |
| Macedonians | 98.8 /100 | #63 | Exceptional 9.9% |
| Immigrants | North America | 98.8 /100 | #64 | Exceptional 9.9% |
| Pennsylvania Germans | 98.7 /100 | #65 | Exceptional 9.9% |
| Immigrants | Netherlands | 98.7 /100 | #66 | Exceptional 9.9% |
| Immigrants | Austria | 98.6 /100 | #67 | Exceptional 9.9% |
| Canadians | 98.5 /100 | #68 | Exceptional 9.9% |
| Australians | 98.4 /100 | #69 | Exceptional 9.9% |
| Samoans | 98.0 /100 | #70 | Exceptional 10.0% |
| Yugoslavians | 97.9 /100 | #71 | Exceptional 10.0% |
| Palestinians | 97.9 /100 | #72 | Exceptional 10.0% |
| Russians | 97.9 /100 | #73 | Exceptional 10.0% |
Demographics Similar to Immigrants from Guyana by Seniors Poverty Over the Age of 65
In terms of seniors poverty over the age of 65, the demographic groups most similar to Immigrants from Guyana are Haitian (14.5%, a difference of 0.030%), Immigrants from Ecuador (14.4%, a difference of 0.21%), Guyanese (14.4%, a difference of 0.24%), Immigrants from Honduras (14.5%, a difference of 0.24%), and Barbadian (14.4%, a difference of 0.64%).
| Demographics | Rating | Rank | Seniors Poverty Over the Age of 65 |
| Hondurans | 0.0 /100 | #309 | Tragic 14.2% |
| Bahamians | 0.0 /100 | #310 | Tragic 14.2% |
| Natives/Alaskans | 0.0 /100 | #311 | Tragic 14.2% |
| Hispanics or Latinos | 0.0 /100 | #312 | Tragic 14.3% |
| Barbadians | 0.0 /100 | #313 | Tragic 14.4% |
| Guyanese | 0.0 /100 | #314 | Tragic 14.4% |
| Immigrants | Ecuador | 0.0 /100 | #315 | Tragic 14.4% |
| Immigrants | Guyana | 0.0 /100 | #316 | Tragic 14.5% |
| Haitians | 0.0 /100 | #317 | Tragic 14.5% |
| Immigrants | Honduras | 0.0 /100 | #318 | Tragic 14.5% |
| Cape Verdeans | 0.0 /100 | #319 | Tragic 14.7% |
| Immigrants | Haiti | 0.0 /100 | #320 | Tragic 14.7% |
| Houma | 0.0 /100 | #321 | Tragic 14.7% |
| Immigrants | Barbados | 0.0 /100 | #322 | Tragic 14.8% |
| Yakama | 0.0 /100 | #323 | Tragic 14.8% |