Immigrants from Netherlands vs Asian Seniors Poverty Over the Age of 65

COMPARE

Immigrants from Netherlands
Race
Ancestry
AfghanAfricanAlaska NativeAlaskan AthabascanAlbanianAleutAlsatianAmericanApacheArabArapahoArgentineanArmenianAssyrian/Chaldean/SyriacAustralianAustrianBahamianBangladeshiBarbadianBasqueBelgianBelizeanBermudanBhutaneseBlackfeetBolivianBrazilianBritishBritish West IndianBulgarianBurmeseCajunCambodianCanadianCape VerdeanCarpatho RusynCelticCentral AmericanCentral American IndianCherokeeCheyenneChickasawChileanChineseChippewaChoctawColombianColvilleComancheCosta RicanCreeCreekCroatianCrowCubanCypriotCzechCzechoslovakianDanishDelawareDominicanDutchDutch West IndianEastern EuropeanEcuadorianEgyptianEnglishEstonianEthiopianEuropeanFijianFilipinoFinnishFrenchFrench American IndianFrench CanadianGermanGerman RussianGhanaianGreekGuamanian/ChamorroGuatemalanGuyaneseHaitianHmongHonduranHopiHoumaHungarianIcelanderIndian (Asian)IndonesianInupiatIranianIraqiIrishIroquoisIsraeliItalianJamaicanJapaneseJordanianKenyanKiowaKoreanLaotianLatvianLebaneseLiberianLithuanianLumbeeLuxembourgerMacedonianMalaysianMalteseMarshalleseMenomineeMexicanMexican American IndianMongolianMoroccanNative HawaiianNavajoNepaleseNew ZealanderNicaraguanNigerianNorthern EuropeanNorwegianOkinawanOsageOttawaPaiutePakistaniPalestinianPanamanianParaguayanPennsylvania GermanPeruvianPimaPolishPortuguesePotawatomiPuebloPuerto RicanPuget Sound SalishRomanianRussianSalvadoranSamoanScandinavianScotch-IrishScottishSeminoleSenegaleseSerbianShoshoneSierra LeoneanSiouxSlavicSlovakSloveneSomaliSouth AfricanSouth AmericanSouth American IndianSoviet UnionSpaniardSpanishSpanish AmericanSpanish American IndianSri LankanSubsaharan AfricanSudaneseSwedishSwissSyrianTaiwaneseThaiTlingit-HaidaTohono O'OdhamTonganTrinidadian and TobagonianTsimshianTurkishU.S. Virgin IslanderUgandanUkrainianUruguayanUteVenezuelanVietnameseWelshWest IndianYakamaYaquiYugoslavianYumanYup'ikZimbabwean
Immigration
NonimmigrantsImmigrantsAfghanistanAfricaAlbaniaArgentinaArmeniaAsiaAustraliaAustriaBahamasBangladeshBarbadosBelarusBelgiumBelizeBoliviaBosnia and HerzegovinaBrazilBulgariaBurma/MyanmarCabo VerdeCambodiaCameroonCanadaCaribbeanCentral AmericaChileChinaColombiaCongoCosta RicaCroatiaCubaCzechoslovakiaDenmarkDominicaDominican RepublicEastern AfricaEastern AsiaEastern EuropeEcuadorEgyptEl SalvadorEnglandEritreaEthiopiaEuropeFijiFranceGermanyGhanaGreeceGrenadaGuatemalaGuyanaHaitiHondurasHong KongHungaryIndiaIndonesiaIranIraqIrelandIsraelItalyJamaicaJapanJordanKazakhstanKenyaKoreaKuwaitLaosLatin AmericaLatviaLebanonLiberiaLithuaniaMalaysiaMexicoMicronesiaMiddle AfricaMoldovaMoroccoNepalNetherlandsNicaraguaNigeriaNorth AmericaNorth MacedoniaNorthern AfricaNorthern EuropeNorwayOceaniaPakistanPanamaPeruPhilippinesPolandPortugalRomaniaRussiaSaudi ArabiaScotlandSenegalSerbiaSierra LeoneSingaporeSomaliaSouth AfricaSouth AmericaSouth Central AsiaSouth Eastern AsiaSouthern EuropeSpainSri LankaSt. Vincent and the GrenadinesSudanSwedenSwitzerlandSyriaTaiwanThailandTrinidad and TobagoTurkeyUgandaUkraineUruguayUzbekistanVenezuelaVietnamWest IndiesWestern AfricaWestern AsiaWestern EuropeYemenZaireZimbabweAzores
Asian
Race
Ancestry
AfghanAfricanAlaska NativeAlaskan AthabascanAlbanianAleutAlsatianAmericanApacheArabArapahoArgentineanArmenianAssyrian/Chaldean/SyriacAustralianAustrianBahamianBangladeshiBarbadianBasqueBelgianBelizeanBermudanBhutaneseBlackfeetBolivianBrazilianBritishBritish West IndianBulgarianBurmeseCajunCambodianCanadianCape VerdeanCarpatho RusynCelticCentral AmericanCentral American IndianCherokeeCheyenneChickasawChileanChineseChippewaChoctawColombianColvilleComancheCosta RicanCreeCreekCroatianCrowCubanCypriotCzechCzechoslovakianDanishDelawareDominicanDutchDutch West IndianEastern EuropeanEcuadorianEgyptianEnglishEstonianEthiopianEuropeanFijianFilipinoFinnishFrenchFrench American IndianFrench CanadianGermanGerman RussianGhanaianGreekGuamanian/ChamorroGuatemalanGuyaneseHaitianHmongHonduranHopiHoumaHungarianIcelanderIndian (Asian)IndonesianInupiatIranianIraqiIrishIroquoisIsraeliItalianJamaicanJapaneseJordanianKenyanKiowaKoreanLaotianLatvianLebaneseLiberianLithuanianLumbeeLuxembourgerMacedonianMalaysianMalteseMarshalleseMenomineeMexicanMexican American IndianMongolianMoroccanNative HawaiianNavajoNepaleseNew ZealanderNicaraguanNigerianNorthern EuropeanNorwegianOkinawanOsageOttawaPaiutePakistaniPalestinianPanamanianParaguayanPennsylvania GermanPeruvianPimaPolishPortuguesePotawatomiPuebloPuerto RicanPuget Sound SalishRomanianRussianSalvadoranSamoanScandinavianScotch-IrishScottishSeminoleSenegaleseSerbianShoshoneSierra LeoneanSiouxSlavicSlovakSloveneSomaliSouth AfricanSouth AmericanSouth American IndianSoviet UnionSpaniardSpanishSpanish AmericanSpanish American IndianSri LankanSubsaharan AfricanSudaneseSwedishSwissSyrianTaiwaneseThaiTlingit-HaidaTohono O'OdhamTonganTrinidadian and TobagonianTsimshianTurkishU.S. Virgin IslanderUgandanUkrainianUruguayanUteVenezuelanVietnameseWelshWest IndianYakamaYaquiYugoslavianYumanYup'ikZimbabwean
Immigration
NonimmigrantsImmigrantsAfghanistanAfricaAlbaniaArgentinaArmeniaAsiaAustraliaAustriaBahamasBangladeshBarbadosBelarusBelgiumBelizeBoliviaBosnia and HerzegovinaBrazilBulgariaBurma/MyanmarCabo VerdeCambodiaCameroonCanadaCaribbeanCentral AmericaChileChinaColombiaCongoCosta RicaCroatiaCubaCzechoslovakiaDenmarkDominicaDominican RepublicEastern AfricaEastern AsiaEastern EuropeEcuadorEgyptEl SalvadorEnglandEritreaEthiopiaEuropeFijiFranceGermanyGhanaGreeceGrenadaGuatemalaGuyanaHaitiHondurasHong KongHungaryIndiaIndonesiaIranIraqIrelandIsraelItalyJamaicaJapanJordanKazakhstanKenyaKoreaKuwaitLaosLatin AmericaLatviaLebanonLiberiaLithuaniaMalaysiaMexicoMicronesiaMiddle AfricaMoldovaMoroccoNepalNicaraguaNigeriaNorth AmericaNorth MacedoniaNorthern AfricaNorthern EuropeNorwayOceaniaPakistanPanamaPeruPhilippinesPolandPortugalRomaniaRussiaSaudi ArabiaScotlandSenegalSerbiaSierra LeoneSingaporeSomaliaSouth AfricaSouth AmericaSouth Central AsiaSouth Eastern AsiaSouthern EuropeSpainSri LankaSt. Vincent and the GrenadinesSudanSwedenSwitzerlandSyriaTaiwanThailandTrinidad and TobagoTurkeyUgandaUkraineUruguayUzbekistanVenezuelaVietnamWest IndiesWestern AfricaWestern AsiaWestern EuropeYemenZaireZimbabweAzores
Seniors Poverty Over the Age of 65
Income
Poverty
Unemployment
Labor Participation
Family Structure
Vehicle Availability
Education Level
Disability

Seniors Poverty Over the Age of 65 Comparison

Immigrants from Netherlands

Asians

Exceptional
Excellent
9.9%
SENIORS POVERTY OVER THE AGE OF 65
98.7/ 100
METRIC RATING
66th/ 347
METRIC RANK
10.4%
SENIORS POVERTY OVER THE AGE OF 65
89.9/ 100
METRIC RATING
124th/ 347
METRIC RANK

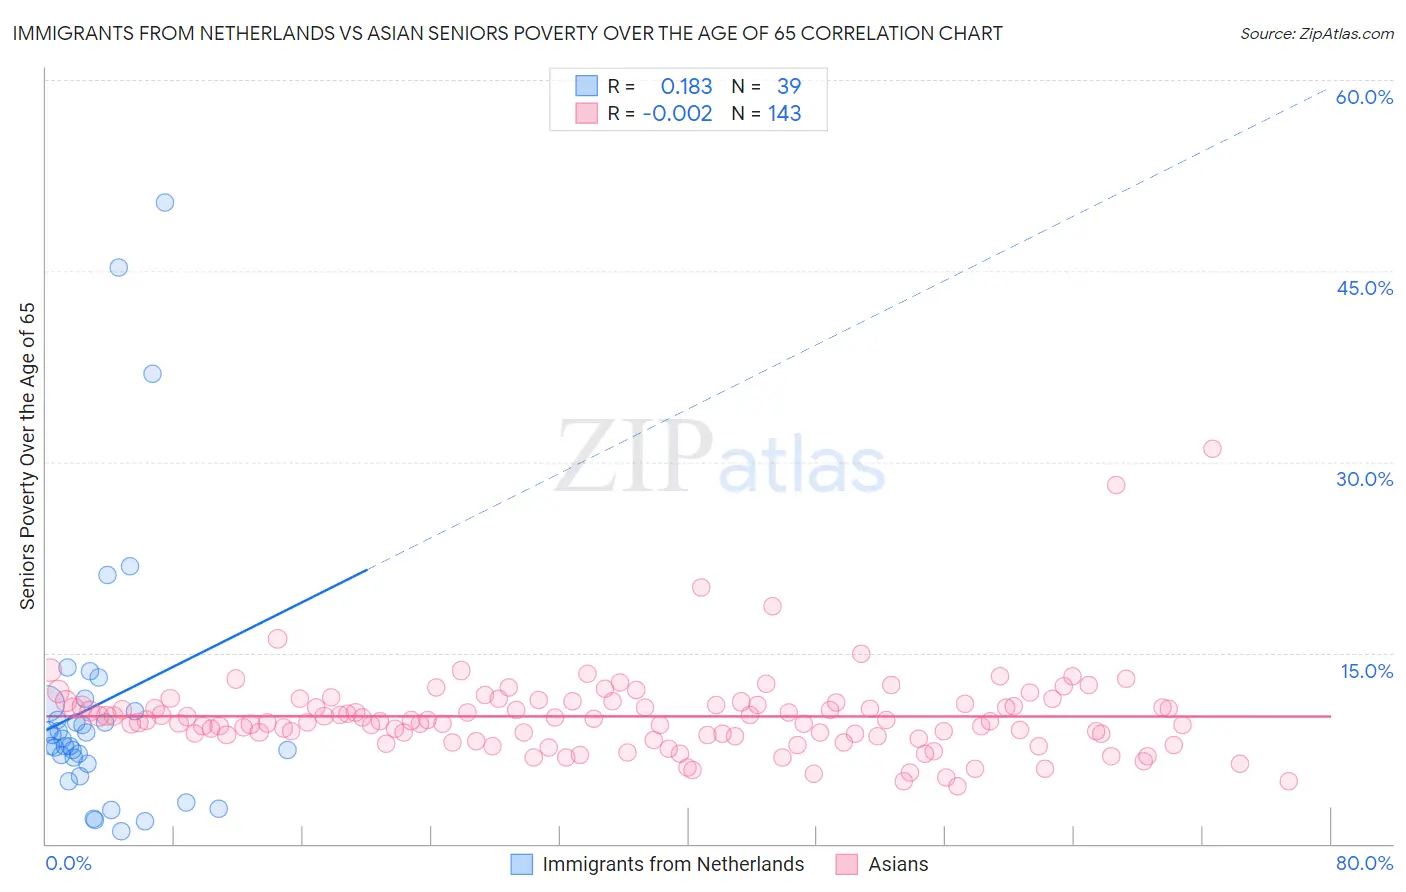
Immigrants from Netherlands vs Asian Seniors Poverty Over the Age of 65 Correlation Chart

The statistical analysis conducted on geographies consisting of 237,542,922 people shows a poor positive correlation between the proportion of Immigrants from Netherlands and poverty level among seniors over the age of 65 in the United States with a correlation coefficient (R) of 0.183 and weighted average of 9.9%. Similarly, the statistical analysis conducted on geographies consisting of 546,650,142 people shows no correlation between the proportion of Asians and poverty level among seniors over the age of 65 in the United States with a correlation coefficient (R) of -0.002 and weighted average of 10.4%, a difference of 5.2%.
Immigrants from Netherlands vs Asian Seniors Poverty Over the Age of 65

Seniors Poverty Over the Age of 65 Correlation Summary

MeasurementImmigrants from NetherlandsAsian
Minimum1.0%4.5%
Maximum50.3%31.1%
Range49.3%26.5%
Mean11.0%10.0%
Median8.2%9.7%
Interquartile 25% (IQ1)6.3%8.5%
Interquartile 75% (IQ3)11.0%11.1%
Interquartile Range (IQR)4.8%2.6%
Standard Deviation (Sample)10.8%3.4%
Standard Deviation (Population)10.7%3.3%

Similar Demographics by Seniors Poverty Over the Age of 65

Demographics Similar to Immigrants from Netherlands by Seniors Poverty Over the Age of 65

In terms of seniors poverty over the age of 65, the demographic groups most similar to Immigrants from Netherlands are Pennsylvania German (9.9%, a difference of 0.050%), Immigrants from Austria (9.9%, a difference of 0.10%), Canadian (9.9%, a difference of 0.32%), Immigrants from North America (9.9%, a difference of 0.33%), and Macedonian (9.9%, a difference of 0.38%).
DemographicsRating | RankSeniors Poverty Over the Age of 65
Immigrants | Canada
99.0
/100
|
#59
Exceptional
9.8%
Celtics
99.0
/100
|
#60
Exceptional
9.8%
Iranians
98.9
/100
|
#61
Exceptional
9.8%
French Canadians
98.9
/100
|
#62
Exceptional
9.8%
Macedonians
98.8
/100
|
#63
Exceptional
9.9%
Immigrants | North America
98.8
/100
|
#64
Exceptional
9.9%
Pennsylvania Germans
98.7
/100
|
#65
Exceptional
9.9%
Immigrants | Netherlands
98.7
/100
|
#66
Exceptional
9.9%
Immigrants | Austria
98.6
/100
|
#67
Exceptional
9.9%
Canadians
98.5
/100
|
#68
Exceptional
9.9%
Australians
98.4
/100
|
#69
Exceptional
9.9%
Samoans
98.0
/100
|
#70
Exceptional
10.0%
Yugoslavians
97.9
/100
|
#71
Exceptional
10.0%
Palestinians
97.9
/100
|
#72
Exceptional
10.0%
Russians
97.9
/100
|
#73
Exceptional
10.0%

Demographics Similar to Asians by Seniors Poverty Over the Age of 65

In terms of seniors poverty over the age of 65, the demographic groups most similar to Asians are Hmong (10.4%, a difference of 0.030%), Immigrants from Philippines (10.4%, a difference of 0.14%), Immigrants from Hungary (10.4%, a difference of 0.20%), Immigrants from Iraq (10.4%, a difference of 0.21%), and Immigrants from Moldova (10.4%, a difference of 0.21%).
DemographicsRating | RankSeniors Poverty Over the Age of 65
Lebanese
92.0
/100
|
#117
Exceptional
10.3%
Okinawans
91.7
/100
|
#118
Exceptional
10.4%
Immigrants | Western Europe
91.1
/100
|
#119
Exceptional
10.4%
Immigrants | Bosnia and Herzegovina
90.8
/100
|
#120
Exceptional
10.4%
Immigrants | Iraq
90.7
/100
|
#121
Exceptional
10.4%
Immigrants | Moldova
90.7
/100
|
#122
Exceptional
10.4%
Hmong
90.0
/100
|
#123
Exceptional
10.4%
Asians
89.9
/100
|
#124
Excellent
10.4%
Immigrants | Philippines
89.4
/100
|
#125
Excellent
10.4%
Immigrants | Hungary
89.1
/100
|
#126
Excellent
10.4%
Cambodians
89.1
/100
|
#127
Excellent
10.4%
Ottawa
88.5
/100
|
#128
Excellent
10.4%
Immigrants | Iran
88.4
/100
|
#129
Excellent
10.4%
Immigrants | Oceania
88.4
/100
|
#130
Excellent
10.4%
Egyptians
87.8
/100
|
#131
Excellent
10.5%