Immigrants from Micronesia vs Immigrants from Morocco Female Poverty Among 25-34 Year Olds
COMPARE
Immigrants from Micronesia
Immigrants from Morocco
Female Poverty Among 25-34 Year Olds
Female Poverty Among 25-34 Year Olds Comparison
Immigrants from Micronesia
Immigrants from Morocco
15.8%
FEMALE POVERTY AMONG 25-34 YEAR OLDS
0.0/ 100
METRIC RATING
277th/ 347
METRIC RANK
12.8%
FEMALE POVERTY AMONG 25-34 YEAR OLDS
93.9/ 100
METRIC RATING
112th/ 347
METRIC RANK
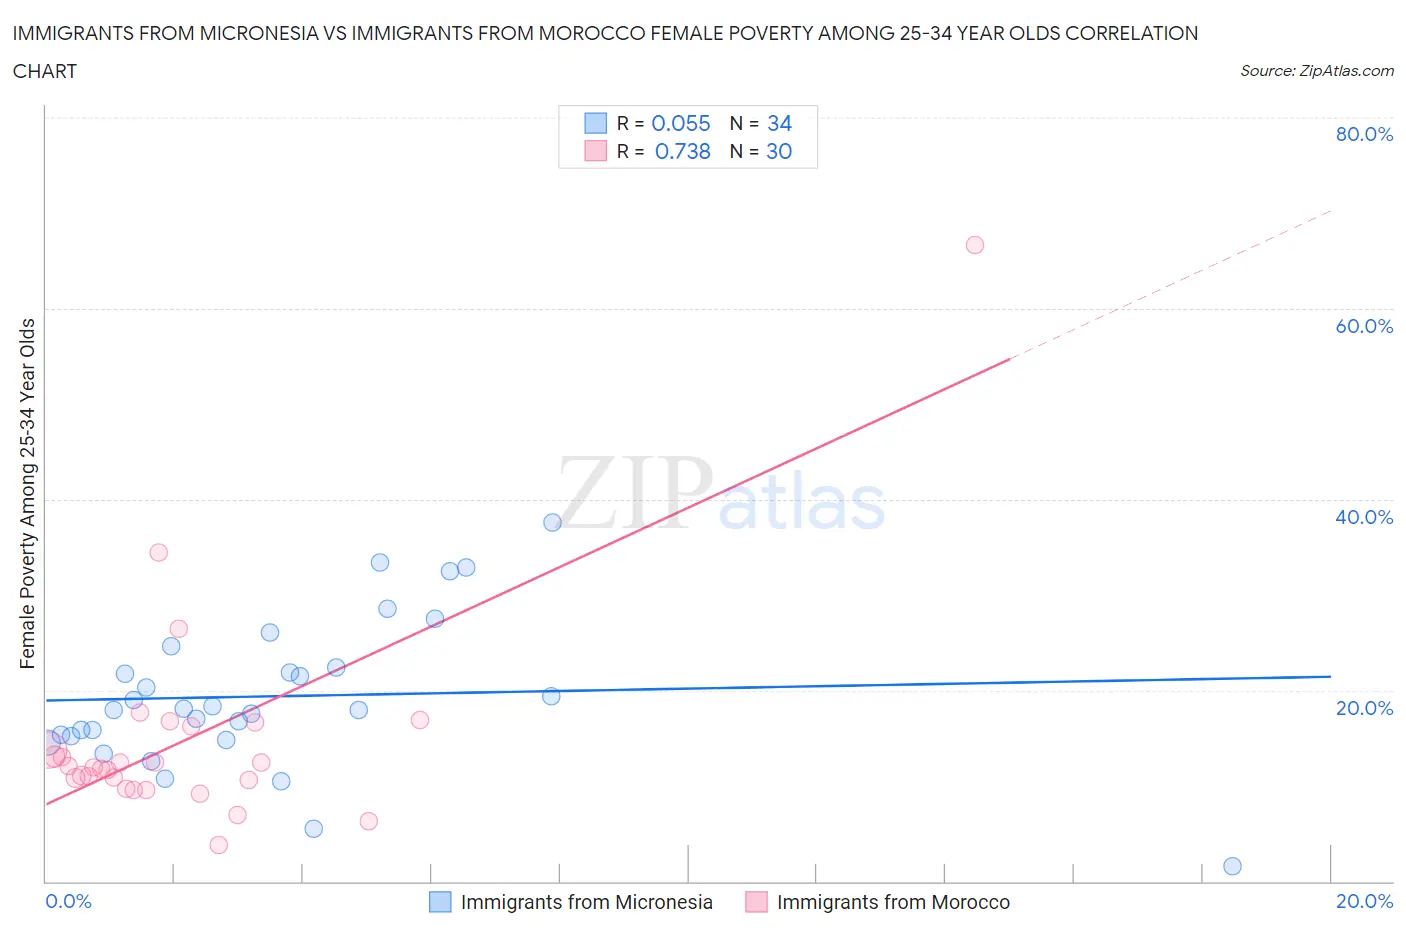
Immigrants from Micronesia vs Immigrants from Morocco Female Poverty Among 25-34 Year Olds Correlation Chart
The statistical analysis conducted on geographies consisting of 61,523,063 people shows a slight positive correlation between the proportion of Immigrants from Micronesia and poverty level among females between the ages 25 and 34 in the United States with a correlation coefficient (R) of 0.055 and weighted average of 15.8%. Similarly, the statistical analysis conducted on geographies consisting of 177,827,944 people shows a strong positive correlation between the proportion of Immigrants from Morocco and poverty level among females between the ages 25 and 34 in the United States with a correlation coefficient (R) of 0.738 and weighted average of 12.8%, a difference of 24.1%.
Female Poverty Among 25-34 Year Olds Correlation Summary
| Measurement | Immigrants from Micronesia | Immigrants from Morocco |
| Minimum | 1.5% | 3.8% |
| Maximum | 37.5% | 66.7% |
| Range | 36.0% | 62.9% |
| Mean | 19.4% | 14.9% |
| Median | 18.0% | 12.0% |
| Interquartile 25% (IQ1) | 15.2% | 10.6% |
| Interquartile 75% (IQ3) | 22.4% | 16.2% |
| Interquartile Range (IQR) | 7.2% | 5.6% |
| Standard Deviation (Sample) | 7.8% | 11.4% |
| Standard Deviation (Population) | 7.7% | 11.2% |
Similar Demographics by Female Poverty Among 25-34 Year Olds
Demographics Similar to Immigrants from Micronesia by Female Poverty Among 25-34 Year Olds
In terms of female poverty among 25-34 year olds, the demographic groups most similar to Immigrants from Micronesia are Immigrants from Zaire (15.8%, a difference of 0.010%), French American Indian (15.9%, a difference of 0.29%), Fijian (15.9%, a difference of 0.29%), Immigrants from the Azores (15.8%, a difference of 0.44%), and Bangladeshi (15.9%, a difference of 0.45%).
| Demographics | Rating | Rank | Female Poverty Among 25-34 Year Olds |
| British West Indians | 0.1 /100 | #270 | Tragic 15.6% |
| Cree | 0.1 /100 | #271 | Tragic 15.6% |
| Senegalese | 0.1 /100 | #272 | Tragic 15.6% |
| Immigrants | Nonimmigrants | 0.1 /100 | #273 | Tragic 15.6% |
| Immigrants | Caribbean | 0.0 /100 | #274 | Tragic 15.7% |
| Immigrants | Azores | 0.0 /100 | #275 | Tragic 15.8% |
| Immigrants | Zaire | 0.0 /100 | #276 | Tragic 15.8% |
| Immigrants | Micronesia | 0.0 /100 | #277 | Tragic 15.8% |
| French American Indians | 0.0 /100 | #278 | Tragic 15.9% |
| Fijians | 0.0 /100 | #279 | Tragic 15.9% |
| Bangladeshis | 0.0 /100 | #280 | Tragic 15.9% |
| Immigrants | Latin America | 0.0 /100 | #281 | Tragic 16.0% |
| Aleuts | 0.0 /100 | #282 | Tragic 16.1% |
| Bahamians | 0.0 /100 | #283 | Tragic 16.1% |
| Shoshone | 0.0 /100 | #284 | Tragic 16.2% |
Demographics Similar to Immigrants from Morocco by Female Poverty Among 25-34 Year Olds
In terms of female poverty among 25-34 year olds, the demographic groups most similar to Immigrants from Morocco are Danish (12.8%, a difference of 0.020%), Immigrants from Syria (12.8%, a difference of 0.040%), Australian (12.8%, a difference of 0.090%), Immigrants from Southern Europe (12.8%, a difference of 0.11%), and Immigrants from Peru (12.7%, a difference of 0.17%).
| Demographics | Rating | Rank | Female Poverty Among 25-34 Year Olds |
| Immigrants | South Africa | 95.3 /100 | #105 | Exceptional 12.7% |
| Tsimshian | 95.1 /100 | #106 | Exceptional 12.7% |
| Poles | 94.9 /100 | #107 | Exceptional 12.7% |
| Immigrants | Norway | 94.4 /100 | #108 | Exceptional 12.7% |
| Immigrants | Peru | 94.3 /100 | #109 | Exceptional 12.7% |
| Australians | 94.1 /100 | #110 | Exceptional 12.8% |
| Danes | 93.9 /100 | #111 | Exceptional 12.8% |
| Immigrants | Morocco | 93.9 /100 | #112 | Exceptional 12.8% |
| Immigrants | Syria | 93.8 /100 | #113 | Exceptional 12.8% |
| Immigrants | Southern Europe | 93.6 /100 | #114 | Exceptional 12.8% |
| Immigrants | Brazil | 93.3 /100 | #115 | Exceptional 12.8% |
| Chileans | 93.2 /100 | #116 | Exceptional 12.8% |
| Immigrants | Kuwait | 93.1 /100 | #117 | Exceptional 12.8% |
| Mongolians | 93.0 /100 | #118 | Exceptional 12.8% |
| Immigrants | Nepal | 93.0 /100 | #119 | Exceptional 12.8% |