Immigrants from Micronesia vs Immigrants from Cabo Verde Female Poverty Among 25-34 Year Olds
COMPARE
Immigrants from Micronesia
Immigrants from Cabo Verde
Female Poverty Among 25-34 Year Olds
Female Poverty Among 25-34 Year Olds Comparison
Immigrants from Micronesia
Immigrants from Cabo Verde
15.8%
FEMALE POVERTY AMONG 25-34 YEAR OLDS
0.0/ 100
METRIC RATING
277th/ 347
METRIC RANK
16.9%
FEMALE POVERTY AMONG 25-34 YEAR OLDS
0.0/ 100
METRIC RATING
305th/ 347
METRIC RANK
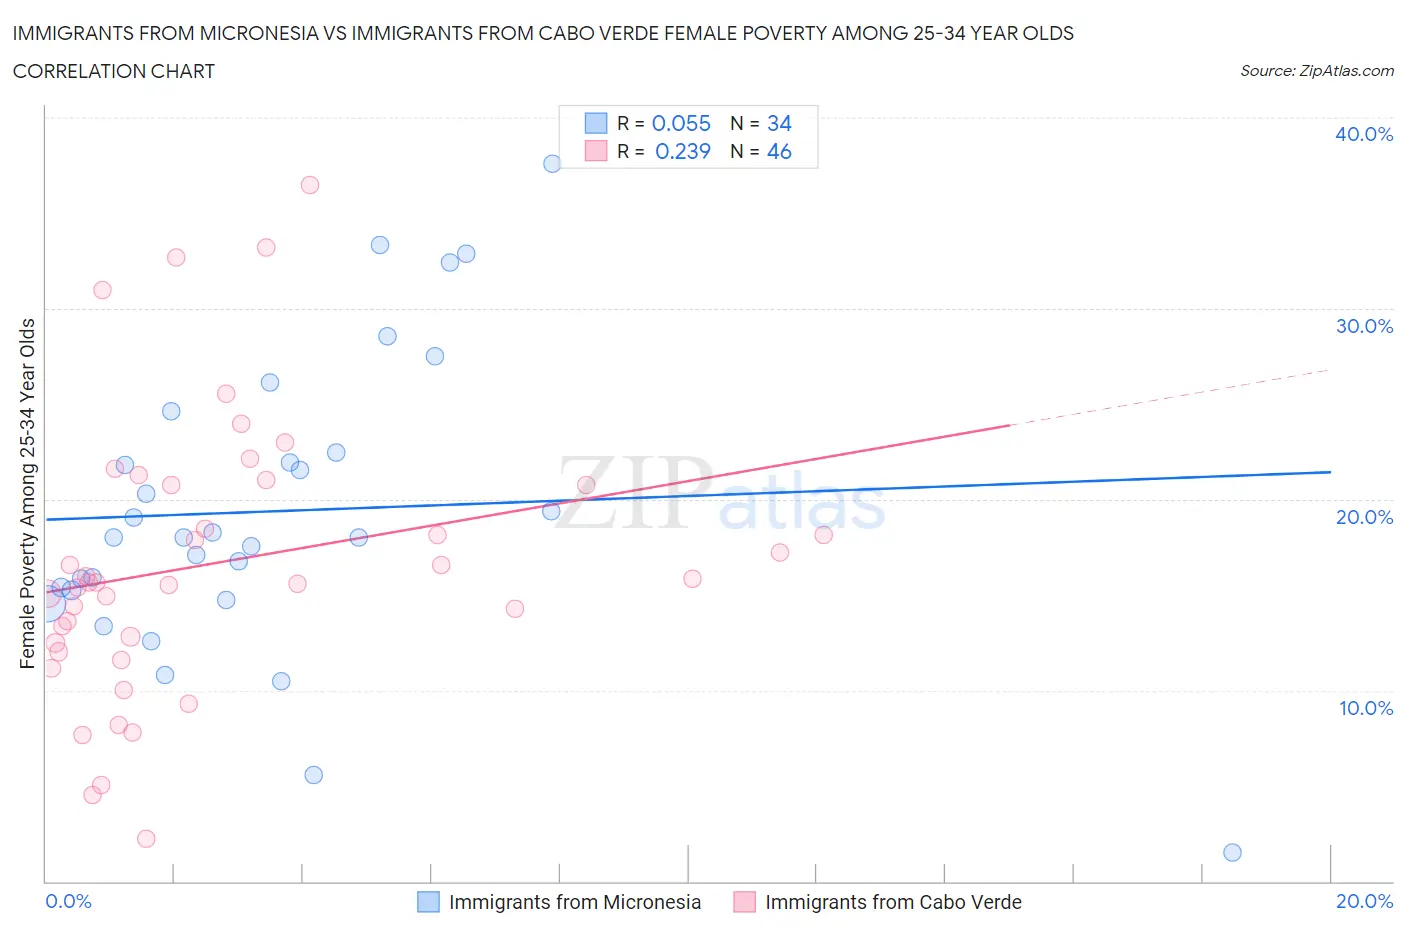
Immigrants from Micronesia vs Immigrants from Cabo Verde Female Poverty Among 25-34 Year Olds Correlation Chart
The statistical analysis conducted on geographies consisting of 61,523,063 people shows a slight positive correlation between the proportion of Immigrants from Micronesia and poverty level among females between the ages 25 and 34 in the United States with a correlation coefficient (R) of 0.055 and weighted average of 15.8%. Similarly, the statistical analysis conducted on geographies consisting of 37,988,788 people shows a weak positive correlation between the proportion of Immigrants from Cabo Verde and poverty level among females between the ages 25 and 34 in the United States with a correlation coefficient (R) of 0.239 and weighted average of 16.9%, a difference of 6.8%.
Female Poverty Among 25-34 Year Olds Correlation Summary
| Measurement | Immigrants from Micronesia | Immigrants from Cabo Verde |
| Minimum | 1.5% | 2.3% |
| Maximum | 37.5% | 36.4% |
| Range | 36.0% | 34.2% |
| Mean | 19.4% | 16.7% |
| Median | 18.0% | 15.6% |
| Interquartile 25% (IQ1) | 15.2% | 12.5% |
| Interquartile 75% (IQ3) | 22.4% | 20.8% |
| Interquartile Range (IQR) | 7.2% | 8.3% |
| Standard Deviation (Sample) | 7.8% | 7.3% |
| Standard Deviation (Population) | 7.7% | 7.2% |
Similar Demographics by Female Poverty Among 25-34 Year Olds
Demographics Similar to Immigrants from Micronesia by Female Poverty Among 25-34 Year Olds
In terms of female poverty among 25-34 year olds, the demographic groups most similar to Immigrants from Micronesia are Immigrants from Zaire (15.8%, a difference of 0.010%), French American Indian (15.9%, a difference of 0.29%), Fijian (15.9%, a difference of 0.29%), Immigrants from the Azores (15.8%, a difference of 0.44%), and Bangladeshi (15.9%, a difference of 0.45%).
| Demographics | Rating | Rank | Female Poverty Among 25-34 Year Olds |
| British West Indians | 0.1 /100 | #270 | Tragic 15.6% |
| Cree | 0.1 /100 | #271 | Tragic 15.6% |
| Senegalese | 0.1 /100 | #272 | Tragic 15.6% |
| Immigrants | Nonimmigrants | 0.1 /100 | #273 | Tragic 15.6% |
| Immigrants | Caribbean | 0.0 /100 | #274 | Tragic 15.7% |
| Immigrants | Azores | 0.0 /100 | #275 | Tragic 15.8% |
| Immigrants | Zaire | 0.0 /100 | #276 | Tragic 15.8% |
| Immigrants | Micronesia | 0.0 /100 | #277 | Tragic 15.8% |
| French American Indians | 0.0 /100 | #278 | Tragic 15.9% |
| Fijians | 0.0 /100 | #279 | Tragic 15.9% |
| Bangladeshis | 0.0 /100 | #280 | Tragic 15.9% |
| Immigrants | Latin America | 0.0 /100 | #281 | Tragic 16.0% |
| Aleuts | 0.0 /100 | #282 | Tragic 16.1% |
| Bahamians | 0.0 /100 | #283 | Tragic 16.1% |
| Shoshone | 0.0 /100 | #284 | Tragic 16.2% |
Demographics Similar to Immigrants from Cabo Verde by Female Poverty Among 25-34 Year Olds
In terms of female poverty among 25-34 year olds, the demographic groups most similar to Immigrants from Cabo Verde are Honduran (16.9%, a difference of 0.17%), Immigrants from Mexico (16.8%, a difference of 0.58%), Chickasaw (17.0%, a difference of 0.58%), Yaqui (17.0%, a difference of 0.60%), and African (17.0%, a difference of 0.80%).
| Demographics | Rating | Rank | Female Poverty Among 25-34 Year Olds |
| Blackfeet | 0.0 /100 | #298 | Tragic 16.7% |
| Spanish Americans | 0.0 /100 | #299 | Tragic 16.7% |
| U.S. Virgin Islanders | 0.0 /100 | #300 | Tragic 16.7% |
| Immigrants | Congo | 0.0 /100 | #301 | Tragic 16.7% |
| Alaska Natives | 0.0 /100 | #302 | Tragic 16.8% |
| Immigrants | Mexico | 0.0 /100 | #303 | Tragic 16.8% |
| Hondurans | 0.0 /100 | #304 | Tragic 16.9% |
| Immigrants | Cabo Verde | 0.0 /100 | #305 | Tragic 16.9% |
| Chickasaw | 0.0 /100 | #306 | Tragic 17.0% |
| Yaqui | 0.0 /100 | #307 | Tragic 17.0% |
| Africans | 0.0 /100 | #308 | Tragic 17.0% |
| Ottawa | 0.0 /100 | #309 | Tragic 17.1% |
| Cherokee | 0.0 /100 | #310 | Tragic 17.2% |
| Immigrants | Honduras | 0.0 /100 | #311 | Tragic 17.3% |
| Iroquois | 0.0 /100 | #312 | Tragic 17.5% |