Immigrants from Micronesia vs Immigrants from Iran Receiving Food Stamps
COMPARE
Immigrants from Micronesia
Immigrants from Iran
Receiving Food Stamps
Receiving Food Stamps Comparison
Immigrants from Micronesia
Immigrants from Iran
13.5%
RECEIVING FOOD STAMPS
1.3/ 100
METRIC RATING
239th/ 347
METRIC RANK
8.3%
RECEIVING FOOD STAMPS
100.0/ 100
METRIC RATING
7th/ 347
METRIC RANK
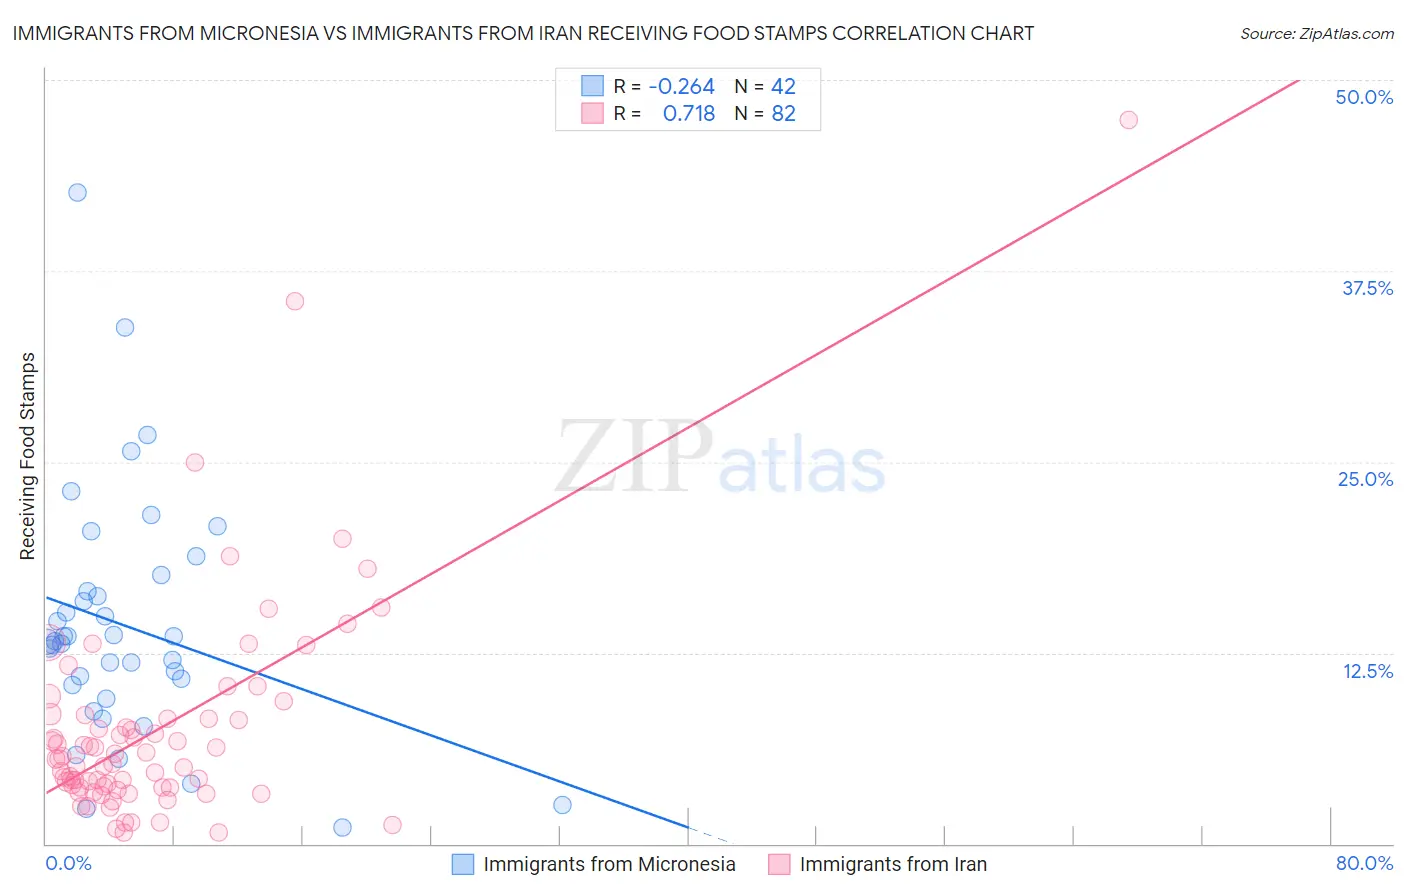
Immigrants from Micronesia vs Immigrants from Iran Receiving Food Stamps Correlation Chart
The statistical analysis conducted on geographies consisting of 61,597,185 people shows a weak negative correlation between the proportion of Immigrants from Micronesia and percentage of population receiving government assistance and/or food stamps in the United States with a correlation coefficient (R) of -0.264 and weighted average of 13.5%. Similarly, the statistical analysis conducted on geographies consisting of 279,188,122 people shows a strong positive correlation between the proportion of Immigrants from Iran and percentage of population receiving government assistance and/or food stamps in the United States with a correlation coefficient (R) of 0.718 and weighted average of 8.3%, a difference of 61.8%.
Receiving Food Stamps Correlation Summary
| Measurement | Immigrants from Micronesia | Immigrants from Iran |
| Minimum | 1.1% | 0.70% |
| Maximum | 42.6% | 47.4% |
| Range | 41.5% | 46.7% |
| Mean | 14.3% | 7.5% |
| Median | 13.3% | 5.6% |
| Interquartile 25% (IQ1) | 10.4% | 3.7% |
| Interquartile 75% (IQ3) | 16.5% | 8.2% |
| Interquartile Range (IQR) | 6.1% | 4.5% |
| Standard Deviation (Sample) | 8.0% | 7.2% |
| Standard Deviation (Population) | 7.9% | 7.2% |
Similar Demographics by Receiving Food Stamps
Demographics Similar to Immigrants from Micronesia by Receiving Food Stamps
In terms of receiving food stamps, the demographic groups most similar to Immigrants from Micronesia are French American Indian (13.5%, a difference of 0.23%), Iroquois (13.5%, a difference of 0.30%), Immigrants from El Salvador (13.5%, a difference of 0.42%), Crow (13.4%, a difference of 0.65%), and Choctaw (13.6%, a difference of 0.73%).
| Demographics | Rating | Rank | Receiving Food Stamps |
| Salvadorans | 2.7 /100 | #232 | Tragic 13.2% |
| Cherokee | 2.5 /100 | #233 | Tragic 13.2% |
| Comanche | 2.4 /100 | #234 | Tragic 13.3% |
| Immigrants | Zaire | 1.9 /100 | #235 | Tragic 13.4% |
| Crow | 1.6 /100 | #236 | Tragic 13.4% |
| Immigrants | El Salvador | 1.5 /100 | #237 | Tragic 13.5% |
| French American Indians | 1.4 /100 | #238 | Tragic 13.5% |
| Immigrants | Micronesia | 1.3 /100 | #239 | Tragic 13.5% |
| Iroquois | 1.2 /100 | #240 | Tragic 13.5% |
| Choctaw | 1.0 /100 | #241 | Tragic 13.6% |
| Immigrants | Panama | 1.0 /100 | #242 | Tragic 13.6% |
| Somalis | 0.9 /100 | #243 | Tragic 13.7% |
| Cajuns | 0.9 /100 | #244 | Tragic 13.7% |
| Immigrants | Somalia | 0.9 /100 | #245 | Tragic 13.7% |
| Cree | 0.8 /100 | #246 | Tragic 13.7% |
Demographics Similar to Immigrants from Iran by Receiving Food Stamps
In terms of receiving food stamps, the demographic groups most similar to Immigrants from Iran are Immigrants from Singapore (8.3%, a difference of 0.56%), Thai (8.1%, a difference of 2.9%), Burmese (8.6%, a difference of 3.6%), Immigrants from Korea (8.7%, a difference of 3.8%), and Iranian (7.9%, a difference of 5.2%).
| Demographics | Rating | Rank | Receiving Food Stamps |
| Immigrants | Taiwan | 100.0 /100 | #1 | Exceptional 7.3% |
| Immigrants | India | 100.0 /100 | #2 | Exceptional 7.4% |
| Filipinos | 100.0 /100 | #3 | Exceptional 7.4% |
| Iranians | 100.0 /100 | #4 | Exceptional 7.9% |
| Thais | 100.0 /100 | #5 | Exceptional 8.1% |
| Immigrants | Singapore | 100.0 /100 | #6 | Exceptional 8.3% |
| Immigrants | Iran | 100.0 /100 | #7 | Exceptional 8.3% |
| Burmese | 99.9 /100 | #8 | Exceptional 8.6% |
| Immigrants | Korea | 99.9 /100 | #9 | Exceptional 8.7% |
| Immigrants | South Central Asia | 99.9 /100 | #10 | Exceptional 8.8% |
| Okinawans | 99.9 /100 | #11 | Exceptional 8.9% |
| Cypriots | 99.9 /100 | #12 | Exceptional 8.9% |
| Bulgarians | 99.9 /100 | #13 | Exceptional 8.9% |
| Maltese | 99.9 /100 | #14 | Exceptional 8.9% |
| Norwegians | 99.9 /100 | #15 | Exceptional 9.0% |