Immigrants from Mexico vs Arab Receiving Food Stamps
COMPARE
Immigrants from Mexico
Arab
Receiving Food Stamps
Receiving Food Stamps Comparison
Immigrants from Mexico
Arabs
15.2%
RECEIVING FOOD STAMPS
0.0/ 100
METRIC RATING
287th/ 347
METRIC RANK
11.5%
RECEIVING FOOD STAMPS
64.7/ 100
METRIC RATING
165th/ 347
METRIC RANK
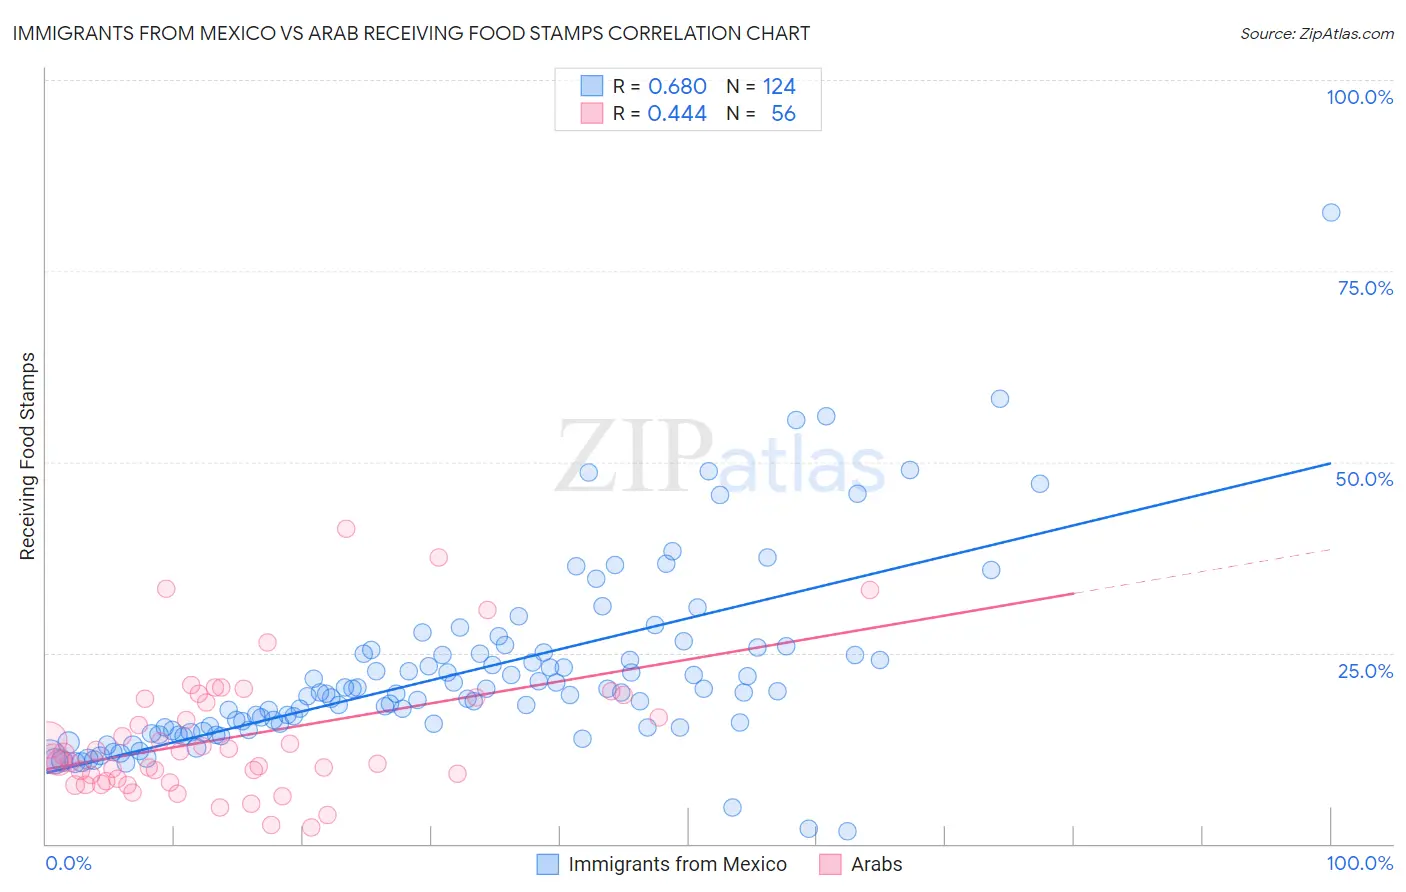
Immigrants from Mexico vs Arab Receiving Food Stamps Correlation Chart
The statistical analysis conducted on geographies consisting of 512,033,306 people shows a significant positive correlation between the proportion of Immigrants from Mexico and percentage of population receiving government assistance and/or food stamps in the United States with a correlation coefficient (R) of 0.680 and weighted average of 15.2%. Similarly, the statistical analysis conducted on geographies consisting of 484,746,764 people shows a moderate positive correlation between the proportion of Arabs and percentage of population receiving government assistance and/or food stamps in the United States with a correlation coefficient (R) of 0.444 and weighted average of 11.5%, a difference of 31.9%.
Receiving Food Stamps Correlation Summary
| Measurement | Immigrants from Mexico | Arab |
| Minimum | 1.6% | 2.1% |
| Maximum | 82.7% | 41.3% |
| Range | 81.1% | 39.2% |
| Mean | 22.3% | 14.1% |
| Median | 19.7% | 11.4% |
| Interquartile 25% (IQ1) | 15.0% | 8.3% |
| Interquartile 75% (IQ3) | 24.9% | 19.0% |
| Interquartile Range (IQR) | 9.9% | 10.7% |
| Standard Deviation (Sample) | 11.9% | 8.5% |
| Standard Deviation (Population) | 11.9% | 8.5% |
Similar Demographics by Receiving Food Stamps
Demographics Similar to Immigrants from Mexico by Receiving Food Stamps
In terms of receiving food stamps, the demographic groups most similar to Immigrants from Mexico are African (15.1%, a difference of 0.23%), Immigrants from Liberia (15.1%, a difference of 0.37%), Immigrants from Belize (15.2%, a difference of 0.46%), Immigrants from Ecuador (15.0%, a difference of 0.75%), and Bangladeshi (15.0%, a difference of 0.76%).
| Demographics | Rating | Rank | Receiving Food Stamps |
| Ecuadorians | 0.0 /100 | #280 | Tragic 14.9% |
| Spanish American Indians | 0.0 /100 | #281 | Tragic 14.9% |
| Immigrants | Central America | 0.0 /100 | #282 | Tragic 15.0% |
| Bangladeshis | 0.0 /100 | #283 | Tragic 15.0% |
| Immigrants | Ecuador | 0.0 /100 | #284 | Tragic 15.0% |
| Immigrants | Liberia | 0.0 /100 | #285 | Tragic 15.1% |
| Africans | 0.0 /100 | #286 | Tragic 15.1% |
| Immigrants | Mexico | 0.0 /100 | #287 | Tragic 15.2% |
| Immigrants | Belize | 0.0 /100 | #288 | Tragic 15.2% |
| Immigrants | Senegal | 0.0 /100 | #289 | Tragic 15.3% |
| Senegalese | 0.0 /100 | #290 | Tragic 15.4% |
| Hondurans | 0.0 /100 | #291 | Tragic 15.5% |
| Alaska Natives | 0.0 /100 | #292 | Tragic 15.6% |
| Vietnamese | 0.0 /100 | #293 | Tragic 15.7% |
| Immigrants | Latin America | 0.0 /100 | #294 | Tragic 15.7% |
Demographics Similar to Arabs by Receiving Food Stamps
In terms of receiving food stamps, the demographic groups most similar to Arabs are Immigrants from Chile (11.5%, a difference of 0.050%), Immigrants from Southern Europe (11.5%, a difference of 0.17%), Immigrants from Belarus (11.5%, a difference of 0.30%), Alsatian (11.4%, a difference of 0.54%), and Pennsylvania German (11.4%, a difference of 0.60%).
| Demographics | Rating | Rank | Receiving Food Stamps |
| Immigrants | Bosnia and Herzegovina | 72.6 /100 | #158 | Good 11.3% |
| Immigrants | Oceania | 70.4 /100 | #159 | Good 11.4% |
| French Canadians | 69.5 /100 | #160 | Good 11.4% |
| Pennsylvania Germans | 68.4 /100 | #161 | Good 11.4% |
| Alsatians | 68.0 /100 | #162 | Good 11.4% |
| Immigrants | Southern Europe | 65.8 /100 | #163 | Good 11.5% |
| Immigrants | Chile | 65.0 /100 | #164 | Good 11.5% |
| Arabs | 64.7 /100 | #165 | Good 11.5% |
| Immigrants | Belarus | 62.8 /100 | #166 | Good 11.5% |
| Kenyans | 60.2 /100 | #167 | Good 11.6% |
| Tlingit-Haida | 59.1 /100 | #168 | Average 11.6% |
| Immigrants | Eastern Africa | 58.3 /100 | #169 | Average 11.6% |
| Costa Ricans | 57.9 /100 | #170 | Average 11.6% |
| Immigrants | Western Asia | 56.4 /100 | #171 | Average 11.6% |
| Guamanians/Chamorros | 54.2 /100 | #172 | Average 11.7% |