Immigrants from Malaysia vs Venezuelan Female Poverty
COMPARE
Immigrants from Malaysia
Venezuelan
Female Poverty
Female Poverty Comparison
Immigrants from Malaysia
Venezuelans
13.0%
FEMALE POVERTY
80.4/ 100
METRIC RATING
143rd/ 347
METRIC RANK
13.5%
FEMALE POVERTY
44.5/ 100
METRIC RATING
181st/ 347
METRIC RANK
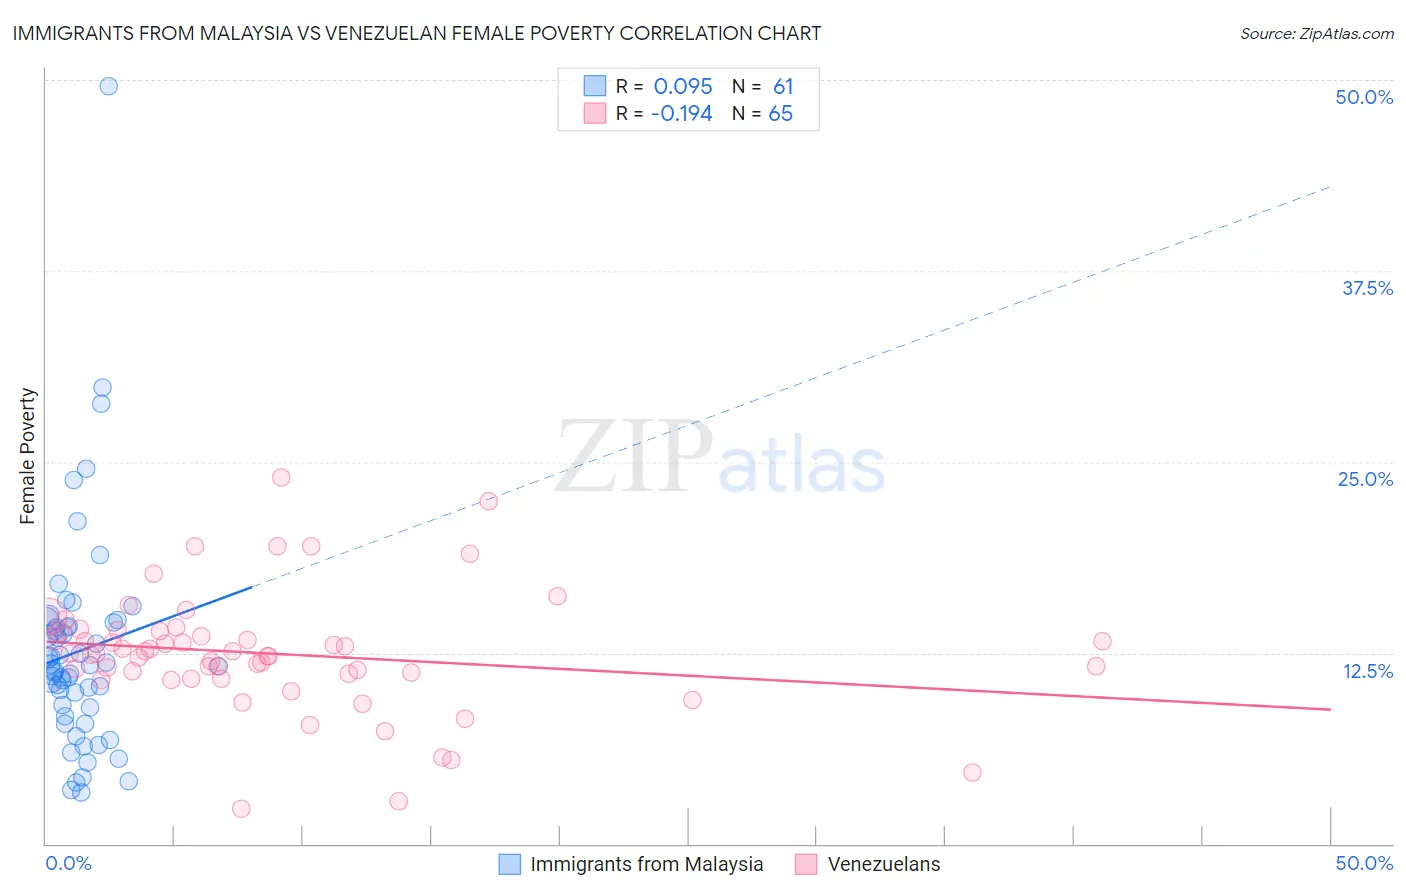
Immigrants from Malaysia vs Venezuelan Female Poverty Correlation Chart
The statistical analysis conducted on geographies consisting of 197,903,089 people shows a slight positive correlation between the proportion of Immigrants from Malaysia and poverty level among females in the United States with a correlation coefficient (R) of 0.095 and weighted average of 13.0%. Similarly, the statistical analysis conducted on geographies consisting of 306,079,170 people shows a poor negative correlation between the proportion of Venezuelans and poverty level among females in the United States with a correlation coefficient (R) of -0.194 and weighted average of 13.5%, a difference of 4.1%.
Female Poverty Correlation Summary
| Measurement | Immigrants from Malaysia | Venezuelan |
| Minimum | 3.4% | 2.3% |
| Maximum | 49.6% | 24.0% |
| Range | 46.2% | 21.7% |
| Mean | 12.6% | 12.4% |
| Median | 11.6% | 12.4% |
| Interquartile 25% (IQ1) | 8.6% | 11.0% |
| Interquartile 75% (IQ3) | 14.3% | 13.9% |
| Interquartile Range (IQR) | 5.7% | 2.9% |
| Standard Deviation (Sample) | 7.3% | 3.9% |
| Standard Deviation (Population) | 7.2% | 3.9% |
Similar Demographics by Female Poverty
Demographics Similar to Immigrants from Malaysia by Female Poverty
In terms of female poverty, the demographic groups most similar to Immigrants from Malaysia are Brazilian (13.0%, a difference of 0.020%), Afghan (13.0%, a difference of 0.090%), Icelander (13.0%, a difference of 0.12%), Syrian (13.0%, a difference of 0.12%), and Immigrants from Peru (13.0%, a difference of 0.19%).
| Demographics | Rating | Rank | Female Poverty |
| Peruvians | 85.2 /100 | #136 | Excellent 12.9% |
| Chileans | 84.7 /100 | #137 | Excellent 12.9% |
| Immigrants | France | 83.6 /100 | #138 | Excellent 12.9% |
| Basques | 83.1 /100 | #139 | Excellent 12.9% |
| Pakistanis | 83.0 /100 | #140 | Excellent 12.9% |
| Icelanders | 81.1 /100 | #141 | Excellent 13.0% |
| Brazilians | 80.5 /100 | #142 | Excellent 13.0% |
| Immigrants | Malaysia | 80.4 /100 | #143 | Excellent 13.0% |
| Afghans | 79.8 /100 | #144 | Good 13.0% |
| Syrians | 79.6 /100 | #145 | Good 13.0% |
| Immigrants | Peru | 79.1 /100 | #146 | Good 13.0% |
| Immigrants | Kazakhstan | 78.6 /100 | #147 | Good 13.0% |
| Yugoslavians | 76.9 /100 | #148 | Good 13.1% |
| Taiwanese | 75.7 /100 | #149 | Good 13.1% |
| Tsimshian | 75.5 /100 | #150 | Good 13.1% |
Demographics Similar to Venezuelans by Female Poverty
In terms of female poverty, the demographic groups most similar to Venezuelans are Immigrants from Colombia (13.5%, a difference of 0.0%), South American (13.5%, a difference of 0.030%), Kenyan (13.5%, a difference of 0.070%), Immigrants from Sierra Leone (13.5%, a difference of 0.13%), and Immigrants from Cameroon (13.5%, a difference of 0.24%).
| Demographics | Rating | Rank | Female Poverty |
| Immigrants | Iraq | 50.0 /100 | #174 | Average 13.4% |
| Celtics | 49.9 /100 | #175 | Average 13.4% |
| Immigrants | Spain | 49.9 /100 | #176 | Average 13.4% |
| Immigrants | Morocco | 49.4 /100 | #177 | Average 13.4% |
| Israelis | 49.1 /100 | #178 | Average 13.5% |
| Immigrants | Syria | 48.8 /100 | #179 | Average 13.5% |
| South Americans | 44.8 /100 | #180 | Average 13.5% |
| Venezuelans | 44.5 /100 | #181 | Average 13.5% |
| Immigrants | Colombia | 44.5 /100 | #182 | Average 13.5% |
| Kenyans | 43.8 /100 | #183 | Average 13.5% |
| Immigrants | Sierra Leone | 43.2 /100 | #184 | Average 13.5% |
| Immigrants | Cameroon | 42.0 /100 | #185 | Average 13.5% |
| Immigrants | Portugal | 41.5 /100 | #186 | Average 13.6% |
| Immigrants | Venezuela | 41.0 /100 | #187 | Average 13.6% |
| Hawaiians | 39.9 /100 | #188 | Fair 13.6% |