Immigrants from Armenia vs Venezuelan Female Poverty
COMPARE
Immigrants from Armenia
Venezuelan
Female Poverty
Female Poverty Comparison
Immigrants from Armenia
Venezuelans
15.1%
FEMALE POVERTY
0.6/ 100
METRIC RATING
238th/ 347
METRIC RANK
13.5%
FEMALE POVERTY
44.5/ 100
METRIC RATING
181st/ 347
METRIC RANK
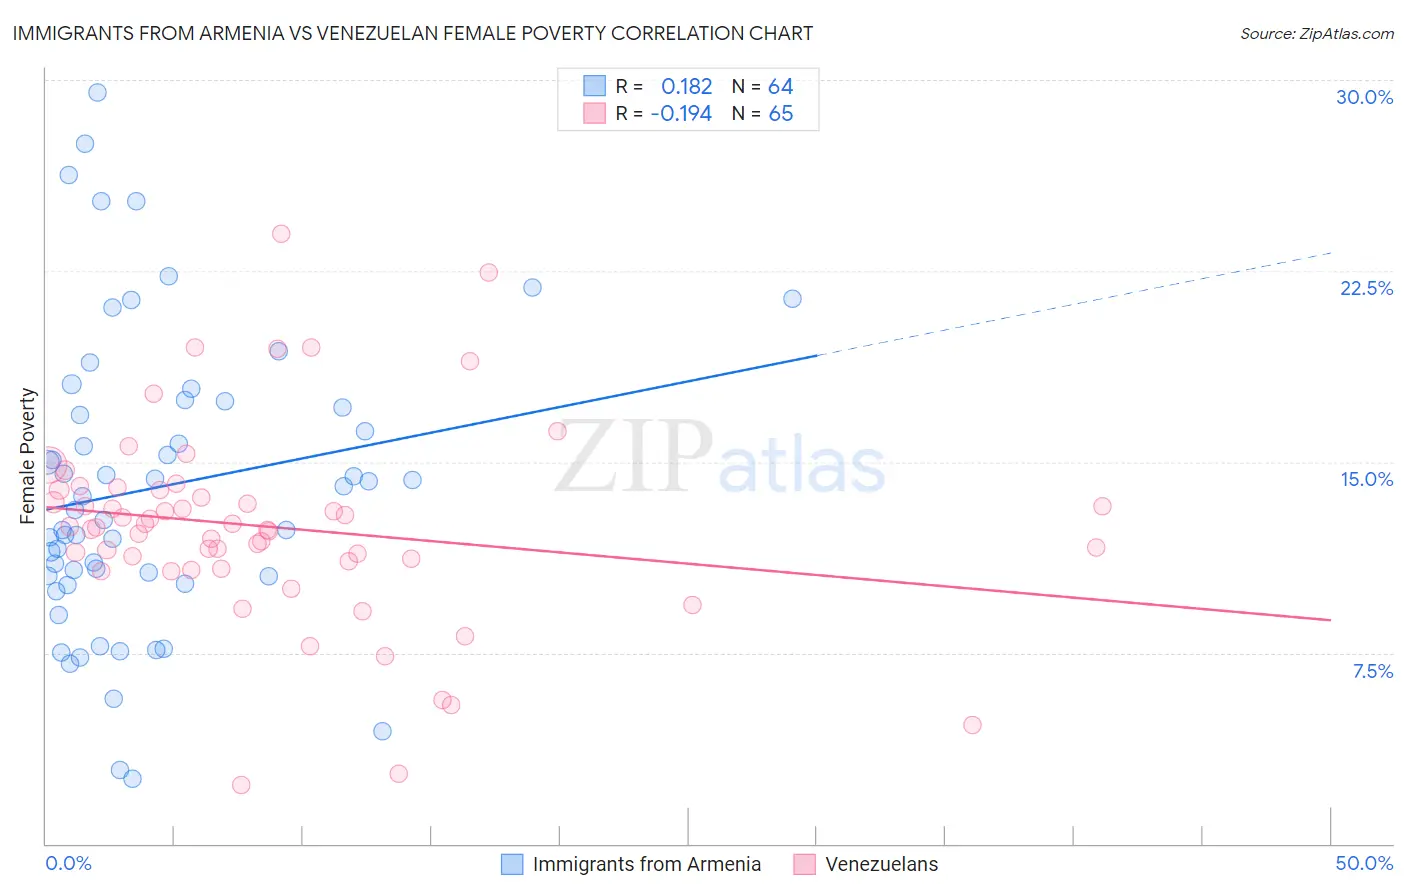
Immigrants from Armenia vs Venezuelan Female Poverty Correlation Chart
The statistical analysis conducted on geographies consisting of 97,710,578 people shows a poor positive correlation between the proportion of Immigrants from Armenia and poverty level among females in the United States with a correlation coefficient (R) of 0.182 and weighted average of 15.1%. Similarly, the statistical analysis conducted on geographies consisting of 306,079,170 people shows a poor negative correlation between the proportion of Venezuelans and poverty level among females in the United States with a correlation coefficient (R) of -0.194 and weighted average of 13.5%, a difference of 11.7%.
Female Poverty Correlation Summary
| Measurement | Immigrants from Armenia | Venezuelan |
| Minimum | 2.5% | 2.3% |
| Maximum | 29.5% | 24.0% |
| Range | 26.9% | 21.7% |
| Mean | 14.0% | 12.4% |
| Median | 13.4% | 12.4% |
| Interquartile 25% (IQ1) | 10.5% | 11.0% |
| Interquartile 75% (IQ3) | 17.3% | 13.9% |
| Interquartile Range (IQR) | 6.7% | 2.9% |
| Standard Deviation (Sample) | 5.8% | 3.9% |
| Standard Deviation (Population) | 5.8% | 3.9% |
Similar Demographics by Female Poverty
Demographics Similar to Immigrants from Armenia by Female Poverty
In terms of female poverty, the demographic groups most similar to Immigrants from Armenia are French American Indian (15.1%, a difference of 0.080%), Cree (15.1%, a difference of 0.26%), Immigrants from Middle Africa (15.2%, a difference of 0.52%), Sudanese (15.2%, a difference of 0.57%), and Immigrants from Sudan (15.2%, a difference of 0.82%).
| Demographics | Rating | Rank | Female Poverty |
| Nigerians | 1.7 /100 | #231 | Tragic 14.8% |
| Osage | 1.5 /100 | #232 | Tragic 14.8% |
| Immigrants | Saudi Arabia | 1.4 /100 | #233 | Tragic 14.8% |
| Fijians | 1.1 /100 | #234 | Tragic 14.9% |
| Immigrants | Laos | 0.9 /100 | #235 | Tragic 15.0% |
| Cree | 0.7 /100 | #236 | Tragic 15.1% |
| French American Indians | 0.6 /100 | #237 | Tragic 15.1% |
| Immigrants | Armenia | 0.6 /100 | #238 | Tragic 15.1% |
| Immigrants | Middle Africa | 0.5 /100 | #239 | Tragic 15.2% |
| Sudanese | 0.5 /100 | #240 | Tragic 15.2% |
| Immigrants | Sudan | 0.4 /100 | #241 | Tragic 15.2% |
| Nepalese | 0.4 /100 | #242 | Tragic 15.2% |
| Nicaraguans | 0.3 /100 | #243 | Tragic 15.3% |
| Ecuadorians | 0.3 /100 | #244 | Tragic 15.3% |
| Spanish American Indians | 0.3 /100 | #245 | Tragic 15.3% |
Demographics Similar to Venezuelans by Female Poverty
In terms of female poverty, the demographic groups most similar to Venezuelans are Immigrants from Colombia (13.5%, a difference of 0.0%), South American (13.5%, a difference of 0.030%), Kenyan (13.5%, a difference of 0.070%), Immigrants from Sierra Leone (13.5%, a difference of 0.13%), and Immigrants from Cameroon (13.5%, a difference of 0.24%).
| Demographics | Rating | Rank | Female Poverty |
| Immigrants | Iraq | 50.0 /100 | #174 | Average 13.4% |
| Celtics | 49.9 /100 | #175 | Average 13.4% |
| Immigrants | Spain | 49.9 /100 | #176 | Average 13.4% |
| Immigrants | Morocco | 49.4 /100 | #177 | Average 13.4% |
| Israelis | 49.1 /100 | #178 | Average 13.5% |
| Immigrants | Syria | 48.8 /100 | #179 | Average 13.5% |
| South Americans | 44.8 /100 | #180 | Average 13.5% |
| Venezuelans | 44.5 /100 | #181 | Average 13.5% |
| Immigrants | Colombia | 44.5 /100 | #182 | Average 13.5% |
| Kenyans | 43.8 /100 | #183 | Average 13.5% |
| Immigrants | Sierra Leone | 43.2 /100 | #184 | Average 13.5% |
| Immigrants | Cameroon | 42.0 /100 | #185 | Average 13.5% |
| Immigrants | Portugal | 41.5 /100 | #186 | Average 13.6% |
| Immigrants | Venezuela | 41.0 /100 | #187 | Average 13.6% |
| Hawaiians | 39.9 /100 | #188 | Fair 13.6% |