Immigrants from Liberia vs Guatemalan Child Poverty Under the Age of 5

COMPARE

Immigrants from Liberia
Race
Ancestry
AfghanAfricanAlaska NativeAlaskan AthabascanAlbanianAleutAlsatianAmericanApacheArabArapahoArgentineanArmenianAssyrian/Chaldean/SyriacAustralianAustrianBahamianBangladeshiBarbadianBasqueBelgianBelizeanBermudanBhutaneseBlackfeetBolivianBrazilianBritishBritish West IndianBulgarianBurmeseCajunCambodianCanadianCape VerdeanCarpatho RusynCelticCentral AmericanCentral American IndianCherokeeCheyenneChickasawChileanChineseChippewaChoctawColombianColvilleComancheCosta RicanCreeCreekCroatianCrowCubanCypriotCzechCzechoslovakianDanishDelawareDominicanDutchDutch West IndianEastern EuropeanEcuadorianEgyptianEnglishEstonianEthiopianEuropeanFijianFilipinoFinnishFrenchFrench American IndianFrench CanadianGermanGerman RussianGhanaianGreekGuamanian/ChamorroGuyaneseHaitianHmongHonduranHopiHoumaHungarianIcelanderIndian (Asian)IndonesianInupiatIranianIraqiIrishIroquoisIsraeliItalianJamaicanJapaneseJordanianKenyanKiowaKoreanLaotianLatvianLebaneseLiberianLithuanianLumbeeLuxembourgerMacedonianMalaysianMalteseMarshalleseMenomineeMexicanMexican American IndianMongolianMoroccanNative HawaiianNavajoNepaleseNew ZealanderNicaraguanNigerianNorthern EuropeanNorwegianOkinawanOsageOttawaPaiutePakistaniPalestinianPanamanianParaguayanPennsylvania GermanPeruvianPimaPolishPortuguesePotawatomiPuebloPuerto RicanPuget Sound SalishRomanianRussianSalvadoranSamoanScandinavianScotch-IrishScottishSeminoleSenegaleseSerbianShoshoneSierra LeoneanSiouxSlavicSlovakSloveneSomaliSouth AfricanSouth AmericanSouth American IndianSoviet UnionSpaniardSpanishSpanish AmericanSpanish American IndianSri LankanSubsaharan AfricanSudaneseSwedishSwissSyrianTaiwaneseThaiTlingit-HaidaTohono O'OdhamTonganTrinidadian and TobagonianTsimshianTurkishU.S. Virgin IslanderUgandanUkrainianUruguayanUteVenezuelanVietnameseWelshWest IndianYakamaYaquiYugoslavianYumanYup'ikZimbabwean
Immigration
NonimmigrantsImmigrantsAfghanistanAfricaAlbaniaArgentinaArmeniaAsiaAustraliaAustriaBahamasBangladeshBarbadosBelarusBelgiumBelizeBoliviaBosnia and HerzegovinaBrazilBulgariaBurma/MyanmarCabo VerdeCambodiaCameroonCanadaCaribbeanCentral AmericaChileChinaColombiaCongoCosta RicaCroatiaCubaCzechoslovakiaDenmarkDominicaDominican RepublicEastern AfricaEastern AsiaEastern EuropeEcuadorEgyptEl SalvadorEnglandEritreaEthiopiaEuropeFijiFranceGermanyGhanaGreeceGrenadaGuatemalaGuyanaHaitiHondurasHong KongHungaryIndiaIndonesiaIranIraqIrelandIsraelItalyJamaicaJapanJordanKazakhstanKenyaKoreaKuwaitLaosLatin AmericaLatviaLebanonLiberiaLithuaniaMalaysiaMexicoMicronesiaMiddle AfricaMoldovaMoroccoNepalNetherlandsNicaraguaNigeriaNorth AmericaNorth MacedoniaNorthern AfricaNorthern EuropeNorwayOceaniaPakistanPanamaPeruPhilippinesPolandPortugalRomaniaRussiaSaudi ArabiaScotlandSenegalSerbiaSierra LeoneSingaporeSomaliaSouth AfricaSouth AmericaSouth Central AsiaSouth Eastern AsiaSouthern EuropeSpainSri LankaSt. Vincent and the GrenadinesSudanSwedenSwitzerlandSyriaTaiwanThailandTrinidad and TobagoTurkeyUgandaUkraineUruguayUzbekistanVenezuelaVietnamWest IndiesWestern AfricaWestern AsiaWestern EuropeYemenZaireZimbabweAzores
Guatemalan
Race
Ancestry
AfghanAfricanAlaska NativeAlaskan AthabascanAlbanianAleutAlsatianAmericanApacheArabArapahoArgentineanArmenianAssyrian/Chaldean/SyriacAustralianAustrianBahamianBangladeshiBarbadianBasqueBelgianBelizeanBermudanBhutaneseBlackfeetBolivianBrazilianBritishBritish West IndianBulgarianBurmeseCajunCambodianCanadianCape VerdeanCarpatho RusynCelticCentral AmericanCentral American IndianCherokeeCheyenneChickasawChileanChineseChippewaChoctawColombianColvilleComancheCosta RicanCreeCreekCroatianCrowCubanCypriotCzechCzechoslovakianDanishDelawareDominicanDutchDutch West IndianEastern EuropeanEcuadorianEgyptianEnglishEstonianEthiopianEuropeanFijianFilipinoFinnishFrenchFrench American IndianFrench CanadianGermanGerman RussianGhanaianGreekGuamanian/ChamorroGuatemalanGuyaneseHaitianHmongHonduranHopiHoumaHungarianIcelanderIndian (Asian)IndonesianInupiatIranianIraqiIrishIroquoisIsraeliItalianJamaicanJapaneseJordanianKenyanKiowaKoreanLaotianLatvianLebaneseLiberianLithuanianLumbeeLuxembourgerMacedonianMalaysianMalteseMarshalleseMenomineeMexicanMexican American IndianMongolianMoroccanNative HawaiianNavajoNepaleseNew ZealanderNicaraguanNigerianNorthern EuropeanNorwegianOkinawanOsageOttawaPaiutePakistaniPalestinianPanamanianParaguayanPennsylvania GermanPeruvianPimaPolishPortuguesePotawatomiPuebloPuerto RicanPuget Sound SalishRomanianRussianSalvadoranSamoanScandinavianScotch-IrishScottishSeminoleSenegaleseSerbianShoshoneSierra LeoneanSiouxSlavicSlovakSloveneSomaliSouth AfricanSouth AmericanSouth American IndianSoviet UnionSpaniardSpanishSpanish AmericanSpanish American IndianSri LankanSubsaharan AfricanSudaneseSwedishSwissSyrianTaiwaneseThaiTlingit-HaidaTohono O'OdhamTonganTrinidadian and TobagonianTsimshianTurkishU.S. Virgin IslanderUgandanUkrainianUruguayanUteVenezuelanVietnameseWelshWest IndianYakamaYaquiYugoslavianYumanYup'ikZimbabwean
Immigration
NonimmigrantsImmigrantsAfghanistanAfricaAlbaniaArgentinaArmeniaAsiaAustraliaAustriaBahamasBangladeshBarbadosBelarusBelgiumBelizeBoliviaBosnia and HerzegovinaBrazilBulgariaBurma/MyanmarCabo VerdeCambodiaCameroonCanadaCaribbeanCentral AmericaChileChinaColombiaCongoCosta RicaCroatiaCubaCzechoslovakiaDenmarkDominicaDominican RepublicEastern AfricaEastern AsiaEastern EuropeEcuadorEgyptEl SalvadorEnglandEritreaEthiopiaEuropeFijiFranceGermanyGhanaGreeceGrenadaGuatemalaGuyanaHaitiHondurasHong KongHungaryIndiaIndonesiaIranIraqIrelandIsraelItalyJamaicaJapanJordanKazakhstanKenyaKoreaKuwaitLaosLatin AmericaLatviaLebanonLithuaniaMalaysiaMexicoMicronesiaMiddle AfricaMoldovaMoroccoNepalNetherlandsNicaraguaNigeriaNorth AmericaNorth MacedoniaNorthern AfricaNorthern EuropeNorwayOceaniaPakistanPanamaPeruPhilippinesPolandPortugalRomaniaRussiaSaudi ArabiaScotlandSenegalSerbiaSierra LeoneSingaporeSomaliaSouth AfricaSouth AmericaSouth Central AsiaSouth Eastern AsiaSouthern EuropeSpainSri LankaSt. Vincent and the GrenadinesSudanSwedenSwitzerlandSyriaTaiwanThailandTrinidad and TobagoTurkeyUgandaUkraineUruguayUzbekistanVenezuelaVietnamWest IndiesWestern AfricaWestern AsiaWestern EuropeYemenZaireZimbabweAzores
Child Poverty Under the Age of 5
Income
Poverty
Unemployment
Labor Participation
Family Structure
Vehicle Availability
Education Level
Disability

Child Poverty Under the Age of 5 Comparison

Immigrants from Liberia

Guatemalans

Tragic
Tragic
20.2%
CHILD POVERTY UNDER THE AGE OF 5
0.1/ 100
METRIC RATING
264th/ 347
METRIC RANK
21.6%
CHILD POVERTY UNDER THE AGE OF 5
0.0/ 100
METRIC RATING
294th/ 347
METRIC RANK

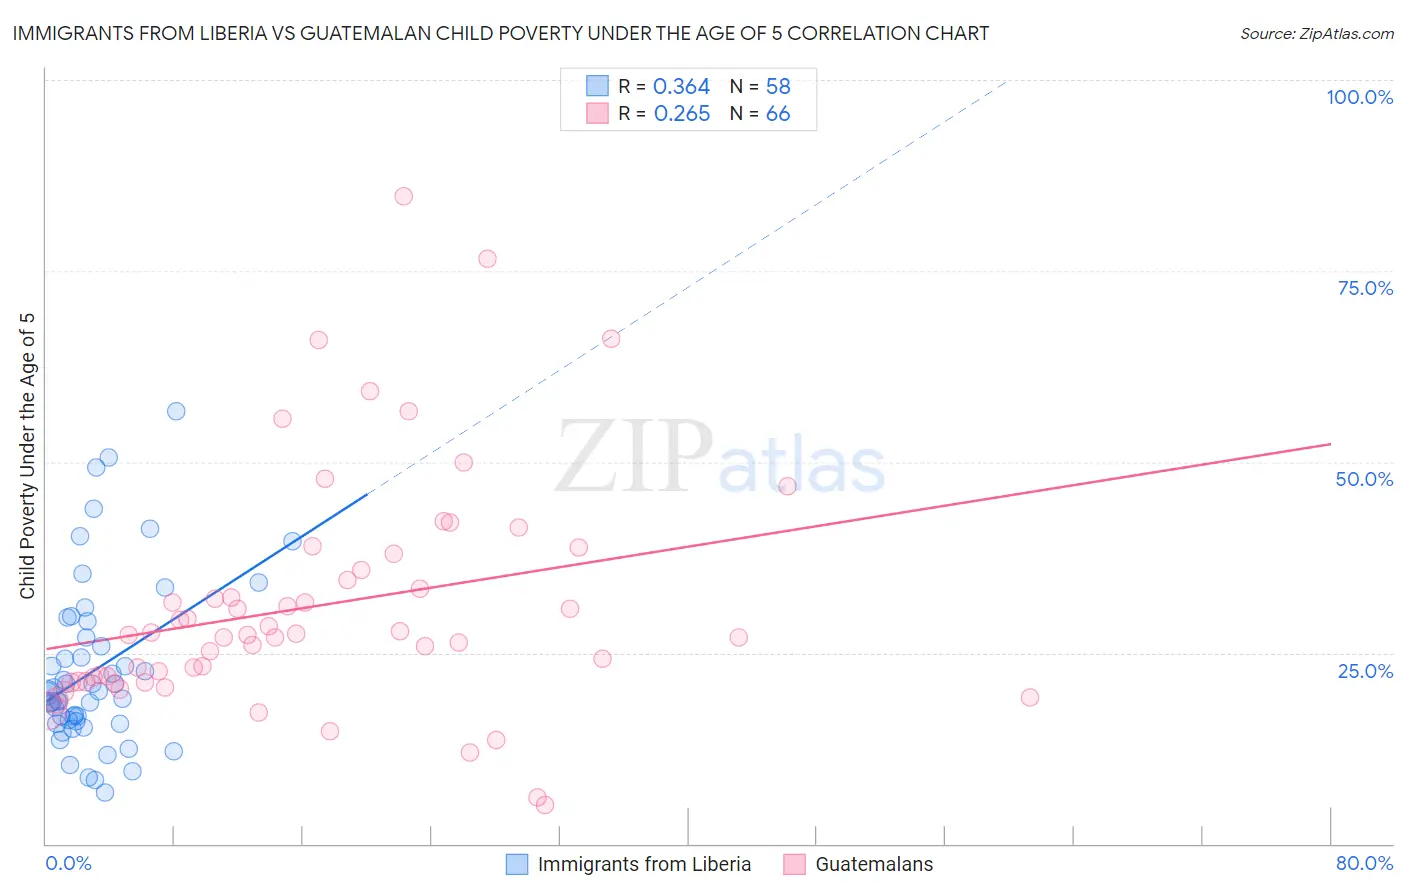
Immigrants from Liberia vs Guatemalan Child Poverty Under the Age of 5 Correlation Chart

The statistical analysis conducted on geographies consisting of 133,700,788 people shows a mild positive correlation between the proportion of Immigrants from Liberia and poverty level among children under the age of 5 in the United States with a correlation coefficient (R) of 0.364 and weighted average of 20.2%. Similarly, the statistical analysis conducted on geographies consisting of 396,996,779 people shows a weak positive correlation between the proportion of Guatemalans and poverty level among children under the age of 5 in the United States with a correlation coefficient (R) of 0.265 and weighted average of 21.6%, a difference of 7.1%.
Immigrants from Liberia vs Guatemalan Child Poverty Under the Age of 5

Child Poverty Under the Age of 5 Correlation Summary

MeasurementImmigrants from LiberiaGuatemalan
Minimum6.7%5.2%
Maximum56.7%84.8%
Range50.0%79.6%
Mean22.7%31.2%
Median19.9%27.3%
Interquartile 25% (IQ1)16.1%21.3%
Interquartile 75% (IQ3)27.0%35.9%
Interquartile Range (IQR)11.0%14.6%
Standard Deviation (Sample)10.9%15.4%
Standard Deviation (Population)10.8%15.3%

Similar Demographics by Child Poverty Under the Age of 5

Demographics Similar to Immigrants from Liberia by Child Poverty Under the Age of 5

In terms of child poverty under the age of 5, the demographic groups most similar to Immigrants from Liberia are Barbadian (20.2%, a difference of 0.12%), Spanish American Indian (20.2%, a difference of 0.12%), Liberian (20.2%, a difference of 0.19%), Aleut (20.3%, a difference of 0.24%), and Immigrants from Bangladesh (20.1%, a difference of 0.60%).
DemographicsRating | RankChild Poverty Under the Age of 5
Shoshone
0.2
/100
|
#257
Tragic
20.0%
Immigrants | St. Vincent and the Grenadines
0.2
/100
|
#258
Tragic
20.0%
Immigrants | El Salvador
0.2
/100
|
#259
Tragic
20.0%
Spanish Americans
0.2
/100
|
#260
Tragic
20.1%
Immigrants | Bangladesh
0.2
/100
|
#261
Tragic
20.1%
Liberians
0.1
/100
|
#262
Tragic
20.2%
Barbadians
0.1
/100
|
#263
Tragic
20.2%
Immigrants | Liberia
0.1
/100
|
#264
Tragic
20.2%
Spanish American Indians
0.1
/100
|
#265
Tragic
20.2%
Aleuts
0.1
/100
|
#266
Tragic
20.3%
Ottawa
0.1
/100
|
#267
Tragic
20.3%
Belizeans
0.1
/100
|
#268
Tragic
20.3%
Immigrants | Burma/Myanmar
0.1
/100
|
#269
Tragic
20.4%
Jamaicans
0.1
/100
|
#270
Tragic
20.4%
Americans
0.1
/100
|
#271
Tragic
20.5%

Demographics Similar to Guatemalans by Child Poverty Under the Age of 5

In terms of child poverty under the age of 5, the demographic groups most similar to Guatemalans are Mexican (21.6%, a difference of 0.14%), Cherokee (21.7%, a difference of 0.26%), Yaqui (21.7%, a difference of 0.41%), Immigrants from Somalia (21.6%, a difference of 0.42%), and Hispanic or Latino (21.7%, a difference of 0.43%).
DemographicsRating | RankChild Poverty Under the Age of 5
Immigrants | Zaire
0.0
/100
|
#287
Tragic
21.3%
Immigrants | Senegal
0.0
/100
|
#288
Tragic
21.3%
Immigrants | Haiti
0.0
/100
|
#289
Tragic
21.3%
Immigrants | Caribbean
0.0
/100
|
#290
Tragic
21.4%
British West Indians
0.0
/100
|
#291
Tragic
21.4%
Immigrants | Somalia
0.0
/100
|
#292
Tragic
21.6%
Mexicans
0.0
/100
|
#293
Tragic
21.6%
Guatemalans
0.0
/100
|
#294
Tragic
21.6%
Cherokee
0.0
/100
|
#295
Tragic
21.7%
Yaqui
0.0
/100
|
#296
Tragic
21.7%
Hispanics or Latinos
0.0
/100
|
#297
Tragic
21.7%
Blackfeet
0.0
/100
|
#298
Tragic
21.8%
Chickasaw
0.0
/100
|
#299
Tragic
21.8%
Alaskan Athabascans
0.0
/100
|
#300
Tragic
21.8%
Immigrants | Central America
0.0
/100
|
#301
Tragic
22.0%