Immigrants from Lebanon vs Immigrants from Trinidad and Tobago Seniors Poverty Over the Age of 75
COMPARE
Immigrants from Lebanon
Immigrants from Trinidad and Tobago
Seniors Poverty Over the Age of 75
Seniors Poverty Over the Age of 75 Comparison
Immigrants from Lebanon
Immigrants from Trinidad and Tobago
12.7%
SENIORS POVERTY OVER THE AGE OF 75
12.7/ 100
METRIC RATING
199th/ 347
METRIC RANK
15.7%
SENIORS POVERTY OVER THE AGE OF 75
0.0/ 100
METRIC RATING
304th/ 347
METRIC RANK
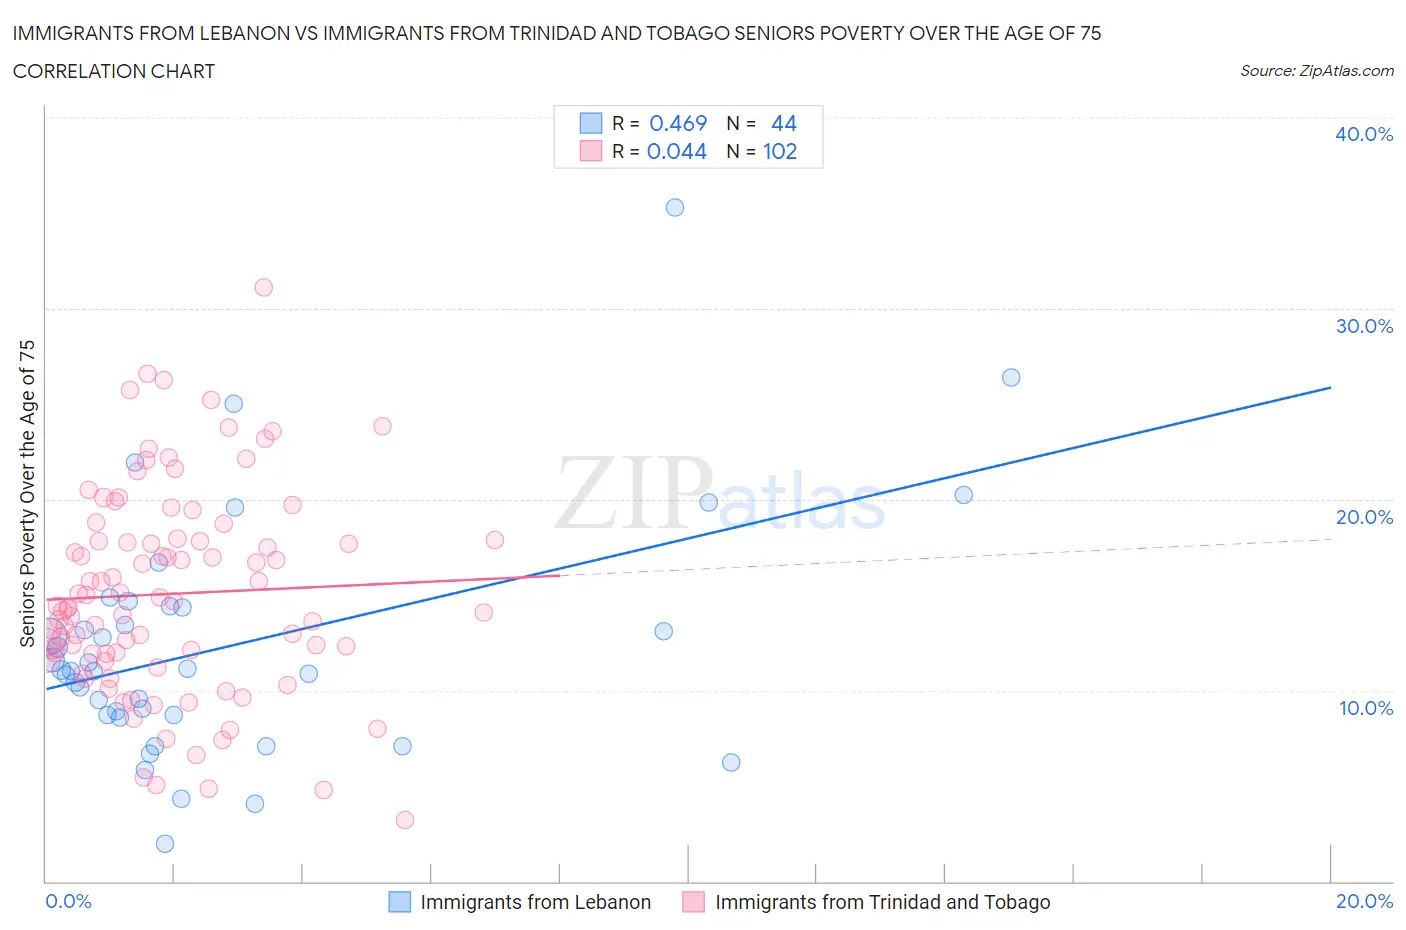
Immigrants from Lebanon vs Immigrants from Trinidad and Tobago Seniors Poverty Over the Age of 75 Correlation Chart
The statistical analysis conducted on geographies consisting of 215,969,018 people shows a moderate positive correlation between the proportion of Immigrants from Lebanon and poverty level among seniors over the age of 75 in the United States with a correlation coefficient (R) of 0.469 and weighted average of 12.7%. Similarly, the statistical analysis conducted on geographies consisting of 222,011,128 people shows no correlation between the proportion of Immigrants from Trinidad and Tobago and poverty level among seniors over the age of 75 in the United States with a correlation coefficient (R) of 0.044 and weighted average of 15.7%, a difference of 24.2%.
Seniors Poverty Over the Age of 75 Correlation Summary
| Measurement | Immigrants from Lebanon | Immigrants from Trinidad and Tobago |
| Minimum | 2.0% | 3.2% |
| Maximum | 35.3% | 31.1% |
| Range | 33.3% | 27.9% |
| Mean | 12.4% | 15.1% |
| Median | 11.0% | 14.4% |
| Interquartile 25% (IQ1) | 8.7% | 11.9% |
| Interquartile 75% (IQ3) | 14.4% | 17.8% |
| Interquartile Range (IQR) | 5.7% | 5.9% |
| Standard Deviation (Sample) | 6.3% | 5.4% |
| Standard Deviation (Population) | 6.3% | 5.4% |
Similar Demographics by Seniors Poverty Over the Age of 75
Demographics Similar to Immigrants from Lebanon by Seniors Poverty Over the Age of 75
In terms of seniors poverty over the age of 75, the demographic groups most similar to Immigrants from Lebanon are Immigrants from Vietnam (12.7%, a difference of 0.10%), Chilean (12.6%, a difference of 0.17%), Nepalese (12.6%, a difference of 0.28%), Paraguayan (12.7%, a difference of 0.30%), and Arapaho (12.7%, a difference of 0.33%).
| Demographics | Rating | Rank | Seniors Poverty Over the Age of 75 |
| Choctaw | 20.2 /100 | #192 | Fair 12.5% |
| Taiwanese | 17.8 /100 | #193 | Poor 12.6% |
| Alsatians | 17.7 /100 | #194 | Poor 12.6% |
| Immigrants | France | 17.4 /100 | #195 | Poor 12.6% |
| Immigrants | Eastern Europe | 16.0 /100 | #196 | Poor 12.6% |
| Nepalese | 14.4 /100 | #197 | Poor 12.6% |
| Chileans | 13.7 /100 | #198 | Poor 12.6% |
| Immigrants | Lebanon | 12.7 /100 | #199 | Poor 12.7% |
| Immigrants | Vietnam | 12.1 /100 | #200 | Poor 12.7% |
| Paraguayans | 11.1 /100 | #201 | Poor 12.7% |
| Arapaho | 10.9 /100 | #202 | Poor 12.7% |
| Immigrants | Southern Europe | 10.7 /100 | #203 | Poor 12.7% |
| Immigrants | Eritrea | 10.5 /100 | #204 | Poor 12.7% |
| Indians (Asian) | 9.7 /100 | #205 | Tragic 12.7% |
| Albanians | 9.6 /100 | #206 | Tragic 12.7% |
Demographics Similar to Immigrants from Trinidad and Tobago by Seniors Poverty Over the Age of 75
In terms of seniors poverty over the age of 75, the demographic groups most similar to Immigrants from Trinidad and Tobago are Ecuadorian (15.7%, a difference of 0.040%), Immigrants from Honduras (15.7%, a difference of 0.18%), Hispanic or Latino (15.8%, a difference of 0.20%), Immigrants from West Indies (15.8%, a difference of 0.34%), and West Indian (15.7%, a difference of 0.35%).
| Demographics | Rating | Rank | Seniors Poverty Over the Age of 75 |
| Hondurans | 0.0 /100 | #297 | Tragic 15.4% |
| Natives/Alaskans | 0.0 /100 | #298 | Tragic 15.5% |
| Spanish American Indians | 0.0 /100 | #299 | Tragic 15.5% |
| Bahamians | 0.0 /100 | #300 | Tragic 15.5% |
| Immigrants | Latin America | 0.0 /100 | #301 | Tragic 15.6% |
| West Indians | 0.0 /100 | #302 | Tragic 15.7% |
| Immigrants | Honduras | 0.0 /100 | #303 | Tragic 15.7% |
| Immigrants | Trinidad and Tobago | 0.0 /100 | #304 | Tragic 15.7% |
| Ecuadorians | 0.0 /100 | #305 | Tragic 15.7% |
| Hispanics or Latinos | 0.0 /100 | #306 | Tragic 15.8% |
| Immigrants | West Indies | 0.0 /100 | #307 | Tragic 15.8% |
| Immigrants | Bangladesh | 0.0 /100 | #308 | Tragic 15.8% |
| Yup'ik | 0.0 /100 | #309 | Tragic 15.8% |
| Vietnamese | 0.0 /100 | #310 | Tragic 15.9% |
| Trinidadians and Tobagonians | 0.0 /100 | #311 | Tragic 15.9% |