Immigrants from Lebanon vs Cajun Child Poverty Under the Age of 5

COMPARE

Immigrants from Lebanon
Race
Ancestry
AfghanAfricanAlaska NativeAlaskan AthabascanAlbanianAleutAlsatianAmericanApacheArabArapahoArgentineanArmenianAssyrian/Chaldean/SyriacAustralianAustrianBahamianBangladeshiBarbadianBasqueBelgianBelizeanBermudanBhutaneseBlackfeetBolivianBrazilianBritishBritish West IndianBulgarianBurmeseCambodianCanadianCape VerdeanCarpatho RusynCelticCentral AmericanCentral American IndianCherokeeCheyenneChickasawChileanChineseChippewaChoctawColombianColvilleComancheCosta RicanCreeCreekCroatianCrowCubanCypriotCzechCzechoslovakianDanishDelawareDominicanDutchDutch West IndianEastern EuropeanEcuadorianEgyptianEnglishEstonianEthiopianEuropeanFijianFilipinoFinnishFrenchFrench American IndianFrench CanadianGermanGerman RussianGhanaianGreekGuamanian/ChamorroGuatemalanGuyaneseHaitianHmongHonduranHopiHoumaHungarianIcelanderIndian (Asian)IndonesianInupiatIranianIraqiIrishIroquoisIsraeliItalianJamaicanJapaneseJordanianKenyanKiowaKoreanLaotianLatvianLebaneseLiberianLithuanianLumbeeLuxembourgerMacedonianMalaysianMalteseMarshalleseMenomineeMexicanMexican American IndianMongolianMoroccanNative HawaiianNavajoNepaleseNew ZealanderNicaraguanNigerianNorthern EuropeanNorwegianOkinawanOsageOttawaPaiutePakistaniPalestinianPanamanianParaguayanPennsylvania GermanPeruvianPimaPolishPortuguesePotawatomiPuebloPuerto RicanPuget Sound SalishRomanianRussianSalvadoranSamoanScandinavianScotch-IrishScottishSeminoleSenegaleseSerbianShoshoneSierra LeoneanSiouxSlavicSlovakSloveneSomaliSouth AfricanSouth AmericanSouth American IndianSoviet UnionSpaniardSpanishSpanish AmericanSpanish American IndianSri LankanSubsaharan AfricanSudaneseSwedishSwissSyrianTaiwaneseThaiTlingit-HaidaTohono O'OdhamTonganTrinidadian and TobagonianTsimshianTurkishU.S. Virgin IslanderUgandanUkrainianUruguayanUteVenezuelanVietnameseWelshWest IndianYakamaYaquiYugoslavianYumanYup'ikZimbabwean
Immigration
NonimmigrantsImmigrantsAfghanistanAfricaAlbaniaArgentinaArmeniaAsiaAustraliaAustriaBahamasBangladeshBarbadosBelarusBelgiumBelizeBoliviaBosnia and HerzegovinaBrazilBulgariaBurma/MyanmarCabo VerdeCambodiaCameroonCanadaCaribbeanCentral AmericaChileChinaColombiaCongoCosta RicaCroatiaCubaCzechoslovakiaDenmarkDominicaDominican RepublicEastern AfricaEastern AsiaEastern EuropeEcuadorEgyptEl SalvadorEnglandEritreaEthiopiaEuropeFijiFranceGermanyGhanaGreeceGrenadaGuatemalaGuyanaHaitiHondurasHong KongHungaryIndiaIndonesiaIranIraqIrelandIsraelItalyJamaicaJapanJordanKazakhstanKenyaKoreaKuwaitLaosLatin AmericaLatviaLebanonLiberiaLithuaniaMalaysiaMexicoMicronesiaMiddle AfricaMoldovaMoroccoNepalNetherlandsNicaraguaNigeriaNorth AmericaNorth MacedoniaNorthern AfricaNorthern EuropeNorwayOceaniaPakistanPanamaPeruPhilippinesPolandPortugalRomaniaRussiaSaudi ArabiaScotlandSenegalSerbiaSierra LeoneSingaporeSomaliaSouth AfricaSouth AmericaSouth Central AsiaSouth Eastern AsiaSouthern EuropeSpainSri LankaSt. Vincent and the GrenadinesSudanSwedenSwitzerlandSyriaTaiwanThailandTrinidad and TobagoTurkeyUgandaUkraineUruguayUzbekistanVenezuelaVietnamWest IndiesWestern AfricaWestern AsiaWestern EuropeYemenZaireZimbabweAzores
Cajun
Race
Ancestry
AfghanAfricanAlaska NativeAlaskan AthabascanAlbanianAleutAlsatianAmericanApacheArabArapahoArgentineanArmenianAssyrian/Chaldean/SyriacAustralianAustrianBahamianBangladeshiBarbadianBasqueBelgianBelizeanBermudanBhutaneseBlackfeetBolivianBrazilianBritishBritish West IndianBulgarianBurmeseCajunCambodianCanadianCape VerdeanCarpatho RusynCelticCentral AmericanCentral American IndianCherokeeCheyenneChickasawChileanChineseChippewaChoctawColombianColvilleComancheCosta RicanCreeCreekCroatianCrowCubanCypriotCzechCzechoslovakianDanishDelawareDominicanDutchDutch West IndianEastern EuropeanEcuadorianEgyptianEnglishEstonianEthiopianEuropeanFijianFilipinoFinnishFrenchFrench American IndianFrench CanadianGermanGerman RussianGhanaianGreekGuamanian/ChamorroGuatemalanGuyaneseHaitianHmongHonduranHopiHoumaHungarianIcelanderIndian (Asian)IndonesianInupiatIranianIraqiIrishIroquoisIsraeliItalianJamaicanJapaneseJordanianKenyanKiowaKoreanLaotianLatvianLebaneseLiberianLithuanianLumbeeLuxembourgerMacedonianMalaysianMalteseMarshalleseMenomineeMexicanMexican American IndianMongolianMoroccanNative HawaiianNavajoNepaleseNew ZealanderNicaraguanNigerianNorthern EuropeanNorwegianOkinawanOsageOttawaPaiutePakistaniPalestinianPanamanianParaguayanPennsylvania GermanPeruvianPimaPolishPortuguesePotawatomiPuebloPuerto RicanPuget Sound SalishRomanianRussianSalvadoranSamoanScandinavianScotch-IrishScottishSeminoleSenegaleseSerbianShoshoneSierra LeoneanSiouxSlavicSlovakSloveneSomaliSouth AfricanSouth AmericanSouth American IndianSoviet UnionSpaniardSpanishSpanish AmericanSpanish American IndianSri LankanSubsaharan AfricanSudaneseSwedishSwissSyrianTaiwaneseThaiTlingit-HaidaTohono O'OdhamTonganTrinidadian and TobagonianTsimshianTurkishU.S. Virgin IslanderUgandanUkrainianUruguayanUteVenezuelanVietnameseWelshWest IndianYakamaYaquiYugoslavianYumanYup'ikZimbabwean
Immigration
NonimmigrantsImmigrantsAfghanistanAfricaAlbaniaArgentinaArmeniaAsiaAustraliaAustriaBahamasBangladeshBarbadosBelarusBelgiumBelizeBoliviaBosnia and HerzegovinaBrazilBulgariaBurma/MyanmarCabo VerdeCambodiaCameroonCanadaCaribbeanCentral AmericaChileChinaColombiaCongoCosta RicaCroatiaCubaCzechoslovakiaDenmarkDominicaDominican RepublicEastern AfricaEastern AsiaEastern EuropeEcuadorEgyptEl SalvadorEnglandEritreaEthiopiaEuropeFijiFranceGermanyGhanaGreeceGrenadaGuatemalaGuyanaHaitiHondurasHong KongHungaryIndiaIndonesiaIranIraqIrelandIsraelItalyJamaicaJapanJordanKazakhstanKenyaKoreaKuwaitLaosLatin AmericaLatviaLiberiaLithuaniaMalaysiaMexicoMicronesiaMiddle AfricaMoldovaMoroccoNepalNetherlandsNicaraguaNigeriaNorth AmericaNorth MacedoniaNorthern AfricaNorthern EuropeNorwayOceaniaPakistanPanamaPeruPhilippinesPolandPortugalRomaniaRussiaSaudi ArabiaScotlandSenegalSerbiaSierra LeoneSingaporeSomaliaSouth AfricaSouth AmericaSouth Central AsiaSouth Eastern AsiaSouthern EuropeSpainSri LankaSt. Vincent and the GrenadinesSudanSwedenSwitzerlandSyriaTaiwanThailandTrinidad and TobagoTurkeyUgandaUkraineUruguayUzbekistanVenezuelaVietnamWest IndiesWestern AfricaWestern AsiaWestern EuropeYemenZaireZimbabweAzores
Child Poverty Under the Age of 5
Income
Poverty
Unemployment
Labor Participation
Family Structure
Vehicle Availability
Education Level
Disability

Child Poverty Under the Age of 5 Comparison

Immigrants from Lebanon

Cajuns

Average
Tragic
17.3%
CHILD POVERTY UNDER THE AGE OF 5
47.6/ 100
METRIC RATING
175th/ 347
METRIC RANK
24.1%
CHILD POVERTY UNDER THE AGE OF 5
0.0/ 100
METRIC RATING
329th/ 347
METRIC RANK

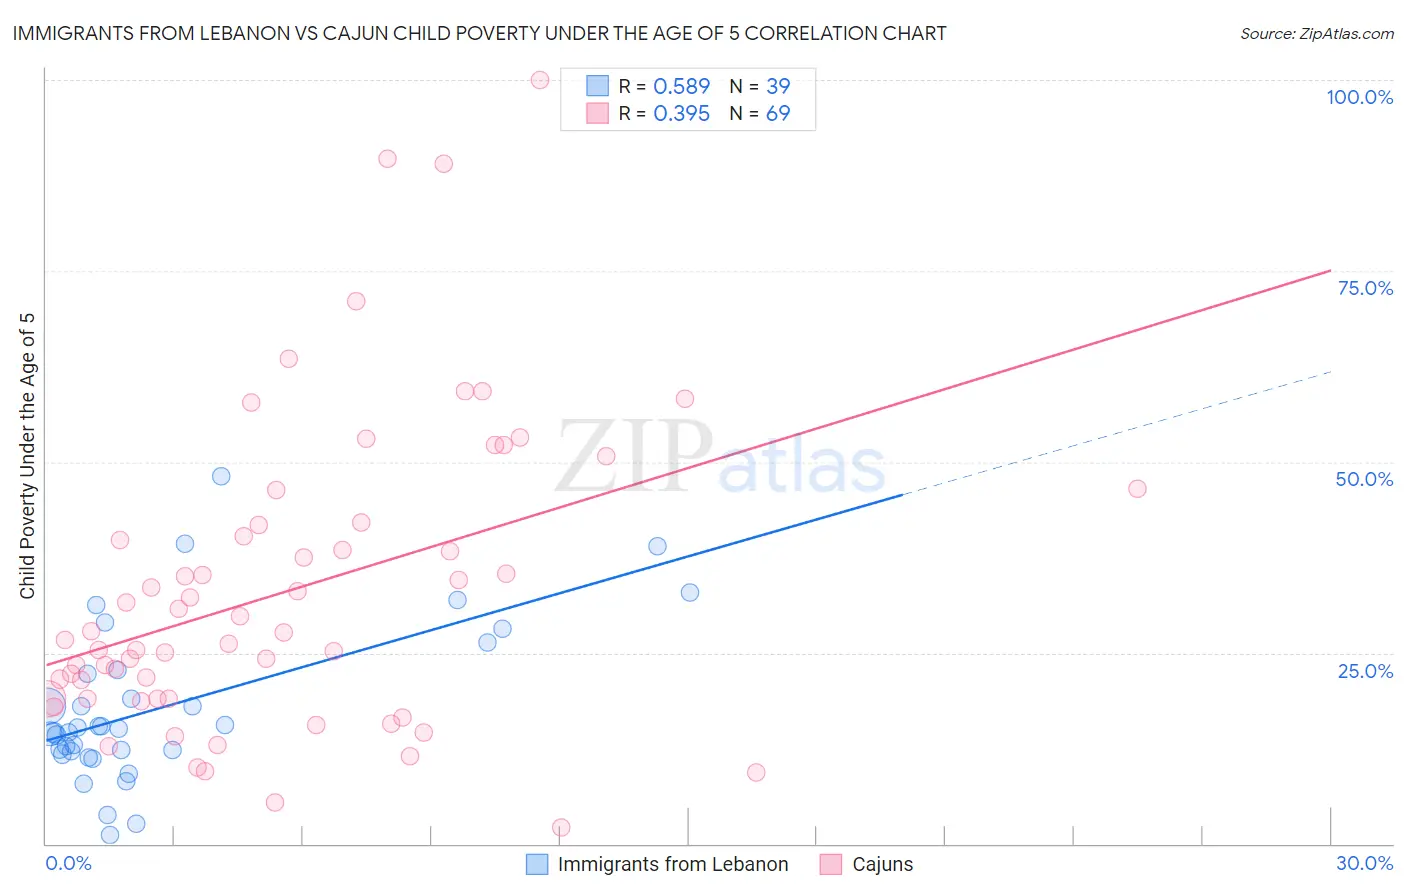
Immigrants from Lebanon vs Cajun Child Poverty Under the Age of 5 Correlation Chart

The statistical analysis conducted on geographies consisting of 210,438,499 people shows a substantial positive correlation between the proportion of Immigrants from Lebanon and poverty level among children under the age of 5 in the United States with a correlation coefficient (R) of 0.589 and weighted average of 17.3%. Similarly, the statistical analysis conducted on geographies consisting of 147,112,871 people shows a mild positive correlation between the proportion of Cajuns and poverty level among children under the age of 5 in the United States with a correlation coefficient (R) of 0.395 and weighted average of 24.1%, a difference of 39.6%.
Immigrants from Lebanon vs Cajun Child Poverty Under the Age of 5

Child Poverty Under the Age of 5 Correlation Summary

MeasurementImmigrants from LebanonCajun
Minimum1.2%2.2%
Maximum48.0%100.0%
Range46.9%97.8%
Mean17.9%33.2%
Median15.0%27.6%
Interquartile 25% (IQ1)12.1%19.0%
Interquartile 75% (IQ3)22.8%41.9%
Interquartile Range (IQR)10.7%23.0%
Standard Deviation (Sample)10.4%20.0%
Standard Deviation (Population)10.3%19.8%

Similar Demographics by Child Poverty Under the Age of 5

Demographics Similar to Immigrants from Lebanon by Child Poverty Under the Age of 5

In terms of child poverty under the age of 5, the demographic groups most similar to Immigrants from Lebanon are Immigrants from Saudi Arabia (17.2%, a difference of 0.25%), Immigrants from Iraq (17.3%, a difference of 0.25%), Immigrants from Sierra Leone (17.3%, a difference of 0.41%), Immigrants from Cameroon (17.4%, a difference of 0.51%), and Hawaiian (17.4%, a difference of 0.64%).
DemographicsRating | RankChild Poverty Under the Age of 5
Uruguayans
60.5
/100
|
#168
Good
17.0%
Immigrants | South America
60.0
/100
|
#169
Good
17.1%
Immigrants | Western Asia
59.2
/100
|
#170
Average
17.1%
Immigrants | Morocco
58.9
/100
|
#171
Average
17.1%
Yugoslavians
54.1
/100
|
#172
Average
17.2%
Welsh
54.0
/100
|
#173
Average
17.2%
Immigrants | Saudi Arabia
50.0
/100
|
#174
Average
17.2%
Immigrants | Lebanon
47.6
/100
|
#175
Average
17.3%
Immigrants | Iraq
45.2
/100
|
#176
Average
17.3%
Immigrants | Sierra Leone
43.6
/100
|
#177
Average
17.3%
Immigrants | Cameroon
42.7
/100
|
#178
Average
17.4%
Hawaiians
41.5
/100
|
#179
Average
17.4%
South American Indians
41.4
/100
|
#180
Average
17.4%
Immigrants | Germany
41.0
/100
|
#181
Average
17.4%
Arabs
40.7
/100
|
#182
Average
17.4%

Demographics Similar to Cajuns by Child Poverty Under the Age of 5

In terms of child poverty under the age of 5, the demographic groups most similar to Cajuns are Immigrants from Dominican Republic (24.1%, a difference of 0.23%), Dominican (24.0%, a difference of 0.32%), Creek (24.2%, a difference of 0.44%), Central American Indian (23.9%, a difference of 0.77%), and Immigrants from Congo (23.9%, a difference of 0.96%).
DemographicsRating | RankChild Poverty Under the Age of 5
Ute
0.0
/100
|
#322
Tragic
23.5%
Pueblo
0.0
/100
|
#323
Tragic
23.7%
Paiute
0.0
/100
|
#324
Tragic
23.8%
Immigrants | Congo
0.0
/100
|
#325
Tragic
23.9%
Central American Indians
0.0
/100
|
#326
Tragic
23.9%
Dominicans
0.0
/100
|
#327
Tragic
24.0%
Immigrants | Dominican Republic
0.0
/100
|
#328
Tragic
24.1%
Cajuns
0.0
/100
|
#329
Tragic
24.1%
Creek
0.0
/100
|
#330
Tragic
24.2%
Kiowa
0.0
/100
|
#331
Tragic
24.5%
Apache
0.0
/100
|
#332
Tragic
25.0%
Natives/Alaskans
0.0
/100
|
#333
Tragic
25.6%
Blacks/African Americans
0.0
/100
|
#334
Tragic
25.7%
Colville
0.0
/100
|
#335
Tragic
25.7%
Sioux
0.0
/100
|
#336
Tragic
26.9%