Cree vs Cajun Child Poverty Under the Age of 5
COMPARE
Cree
Cajun
Child Poverty Under the Age of 5
Child Poverty Under the Age of 5 Comparison
Cree
Cajuns
19.7%
CHILD POVERTY UNDER THE AGE OF 5
0.4/ 100
METRIC RATING
246th/ 347
METRIC RANK
24.1%
CHILD POVERTY UNDER THE AGE OF 5
0.0/ 100
METRIC RATING
329th/ 347
METRIC RANK
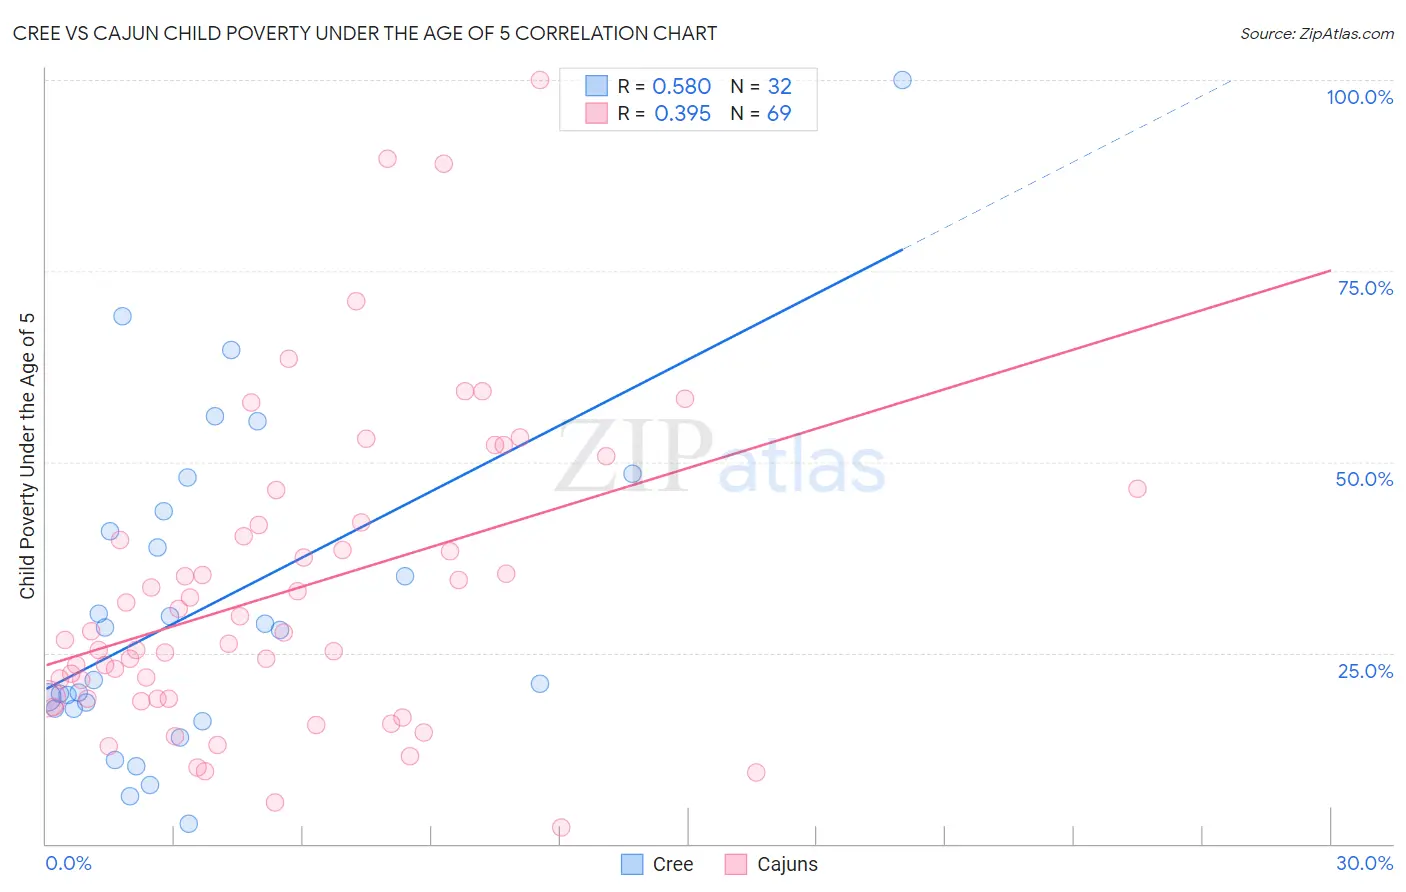
Cree vs Cajun Child Poverty Under the Age of 5 Correlation Chart
The statistical analysis conducted on geographies consisting of 75,401,042 people shows a substantial positive correlation between the proportion of Cree and poverty level among children under the age of 5 in the United States with a correlation coefficient (R) of 0.580 and weighted average of 19.7%. Similarly, the statistical analysis conducted on geographies consisting of 147,112,871 people shows a mild positive correlation between the proportion of Cajuns and poverty level among children under the age of 5 in the United States with a correlation coefficient (R) of 0.395 and weighted average of 24.1%, a difference of 22.4%.
Child Poverty Under the Age of 5 Correlation Summary
| Measurement | Cree | Cajun |
| Minimum | 2.6% | 2.2% |
| Maximum | 100.0% | 100.0% |
| Range | 97.4% | 97.8% |
| Mean | 30.8% | 33.2% |
| Median | 24.7% | 27.6% |
| Interquartile 25% (IQ1) | 17.7% | 19.0% |
| Interquartile 75% (IQ3) | 42.2% | 41.9% |
| Interquartile Range (IQR) | 24.5% | 23.0% |
| Standard Deviation (Sample) | 21.3% | 20.0% |
| Standard Deviation (Population) | 20.9% | 19.8% |
Similar Demographics by Child Poverty Under the Age of 5
Demographics Similar to Cree by Child Poverty Under the Age of 5
In terms of child poverty under the age of 5, the demographic groups most similar to Cree are Immigrants from Western Africa (19.7%, a difference of 0.070%), Guyanese (19.7%, a difference of 0.16%), Marshallese (19.7%, a difference of 0.17%), Immigrants from Middle Africa (19.7%, a difference of 0.19%), and Nonimmigrants (19.7%, a difference of 0.24%).
| Demographics | Rating | Rank | Child Poverty Under the Age of 5 |
| Vietnamese | 0.6 /100 | #239 | Tragic 19.5% |
| Immigrants | Ecuador | 0.5 /100 | #240 | Tragic 19.6% |
| Alaska Natives | 0.5 /100 | #241 | Tragic 19.6% |
| Immigrants | Guyana | 0.5 /100 | #242 | Tragic 19.6% |
| Osage | 0.5 /100 | #243 | Tragic 19.6% |
| Immigrants | Ghana | 0.5 /100 | #244 | Tragic 19.6% |
| Immigrants | Western Africa | 0.4 /100 | #245 | Tragic 19.7% |
| Cree | 0.4 /100 | #246 | Tragic 19.7% |
| Guyanese | 0.4 /100 | #247 | Tragic 19.7% |
| Marshallese | 0.4 /100 | #248 | Tragic 19.7% |
| Immigrants | Middle Africa | 0.4 /100 | #249 | Tragic 19.7% |
| Immigrants | Nonimmigrants | 0.4 /100 | #250 | Tragic 19.7% |
| Pennsylvania Germans | 0.3 /100 | #251 | Tragic 19.8% |
| Immigrants | Nicaragua | 0.3 /100 | #252 | Tragic 19.8% |
| Mexican American Indians | 0.3 /100 | #253 | Tragic 19.9% |
Demographics Similar to Cajuns by Child Poverty Under the Age of 5
In terms of child poverty under the age of 5, the demographic groups most similar to Cajuns are Immigrants from Dominican Republic (24.1%, a difference of 0.23%), Dominican (24.0%, a difference of 0.32%), Creek (24.2%, a difference of 0.44%), Central American Indian (23.9%, a difference of 0.77%), and Immigrants from Congo (23.9%, a difference of 0.96%).
| Demographics | Rating | Rank | Child Poverty Under the Age of 5 |
| Ute | 0.0 /100 | #322 | Tragic 23.5% |
| Pueblo | 0.0 /100 | #323 | Tragic 23.7% |
| Paiute | 0.0 /100 | #324 | Tragic 23.8% |
| Immigrants | Congo | 0.0 /100 | #325 | Tragic 23.9% |
| Central American Indians | 0.0 /100 | #326 | Tragic 23.9% |
| Dominicans | 0.0 /100 | #327 | Tragic 24.0% |
| Immigrants | Dominican Republic | 0.0 /100 | #328 | Tragic 24.1% |
| Cajuns | 0.0 /100 | #329 | Tragic 24.1% |
| Creek | 0.0 /100 | #330 | Tragic 24.2% |
| Kiowa | 0.0 /100 | #331 | Tragic 24.5% |
| Apache | 0.0 /100 | #332 | Tragic 25.0% |
| Natives/Alaskans | 0.0 /100 | #333 | Tragic 25.6% |
| Blacks/African Americans | 0.0 /100 | #334 | Tragic 25.7% |
| Colville | 0.0 /100 | #335 | Tragic 25.7% |
| Sioux | 0.0 /100 | #336 | Tragic 26.9% |