Immigrants from Kuwait vs Immigrants from Oceania Single Female Poverty
COMPARE
Immigrants from Kuwait
Immigrants from Oceania
Single Female Poverty
Single Female Poverty Comparison
Immigrants from Kuwait
Immigrants from Oceania
20.3%
SINGLE FEMALE POVERTY
90.4/ 100
METRIC RATING
139th/ 347
METRIC RANK
20.7%
SINGLE FEMALE POVERTY
74.3/ 100
METRIC RATING
157th/ 347
METRIC RANK
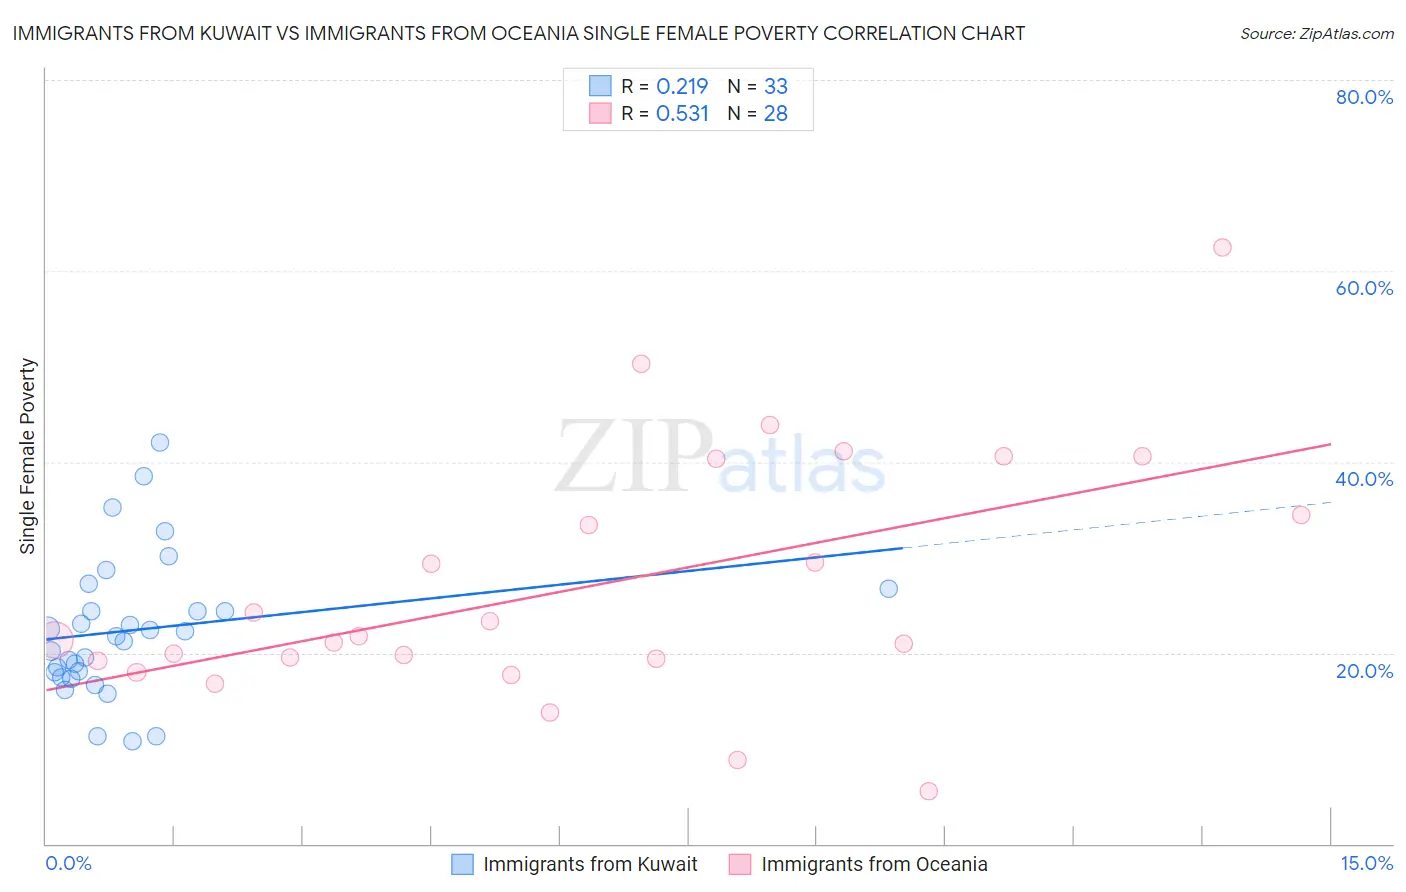
Immigrants from Kuwait vs Immigrants from Oceania Single Female Poverty Correlation Chart
The statistical analysis conducted on geographies consisting of 136,370,378 people shows a weak positive correlation between the proportion of Immigrants from Kuwait and poverty level among single females in the United States with a correlation coefficient (R) of 0.219 and weighted average of 20.3%. Similarly, the statistical analysis conducted on geographies consisting of 301,448,754 people shows a substantial positive correlation between the proportion of Immigrants from Oceania and poverty level among single females in the United States with a correlation coefficient (R) of 0.531 and weighted average of 20.7%, a difference of 1.9%.
Single Female Poverty Correlation Summary
| Measurement | Immigrants from Kuwait | Immigrants from Oceania |
| Minimum | 10.8% | 5.6% |
| Maximum | 42.0% | 62.5% |
| Range | 31.3% | 56.9% |
| Mean | 22.4% | 27.0% |
| Median | 21.7% | 21.6% |
| Interquartile 25% (IQ1) | 17.7% | 19.3% |
| Interquartile 75% (IQ3) | 25.5% | 37.4% |
| Interquartile Range (IQR) | 7.9% | 18.1% |
| Standard Deviation (Sample) | 7.3% | 13.1% |
| Standard Deviation (Population) | 7.2% | 12.8% |
Demographics Similar to Immigrants from Kuwait and Immigrants from Oceania by Single Female Poverty
In terms of single female poverty, the demographic groups most similar to Immigrants from Kuwait are Slovene (20.3%, a difference of 0.010%), Syrian (20.3%, a difference of 0.010%), Immigrants from North America (20.3%, a difference of 0.16%), Immigrants from Uganda (20.3%, a difference of 0.23%), and Australian (20.3%, a difference of 0.35%). Similarly, the demographic groups most similar to Immigrants from Oceania are Danish (20.7%, a difference of 0.11%), South American Indian (20.6%, a difference of 0.12%), Samoan (20.6%, a difference of 0.15%), Immigrants from Western Europe (20.6%, a difference of 0.21%), and Swedish (20.6%, a difference of 0.24%).
| Demographics | Rating | Rank | Single Female Poverty |
| Slovenes | 90.5 /100 | #138 | Exceptional 20.3% |
| Immigrants | Kuwait | 90.4 /100 | #139 | Exceptional 20.3% |
| Syrians | 90.4 /100 | #140 | Exceptional 20.3% |
| Immigrants | North America | 89.5 /100 | #141 | Excellent 20.3% |
| Immigrants | Uganda | 89.1 /100 | #142 | Excellent 20.3% |
| Australians | 88.4 /100 | #143 | Excellent 20.3% |
| Immigrants | Uzbekistan | 88.3 /100 | #144 | Excellent 20.3% |
| Austrians | 85.8 /100 | #145 | Excellent 20.4% |
| Venezuelans | 85.5 /100 | #146 | Excellent 20.4% |
| South Africans | 85.3 /100 | #147 | Excellent 20.4% |
| Luxembourgers | 84.9 /100 | #148 | Excellent 20.4% |
| Portuguese | 81.5 /100 | #149 | Excellent 20.5% |
| Immigrants | Denmark | 80.5 /100 | #150 | Excellent 20.5% |
| Puget Sound Salish | 79.6 /100 | #151 | Good 20.6% |
| Immigrants | Uruguay | 77.7 /100 | #152 | Good 20.6% |
| Swedes | 77.1 /100 | #153 | Good 20.6% |
| Immigrants | Western Europe | 76.7 /100 | #154 | Good 20.6% |
| Samoans | 76.0 /100 | #155 | Good 20.6% |
| South American Indians | 75.7 /100 | #156 | Good 20.6% |
| Immigrants | Oceania | 74.3 /100 | #157 | Good 20.7% |
| Danes | 73.0 /100 | #158 | Good 20.7% |