Immigrants from Korea vs Norwegian Female Poverty Among 18-24 Year Olds
COMPARE
Immigrants from Korea
Norwegian
Female Poverty Among 18-24 Year Olds
Female Poverty Among 18-24 Year Olds Comparison
Immigrants from Korea
Norwegians
18.6%
FEMALE POVERTY AMONG 18-24 YEAR OLDS
99.8/ 100
METRIC RATING
67th/ 347
METRIC RANK
20.7%
FEMALE POVERTY AMONG 18-24 YEAR OLDS
7.3/ 100
METRIC RATING
225th/ 347
METRIC RANK
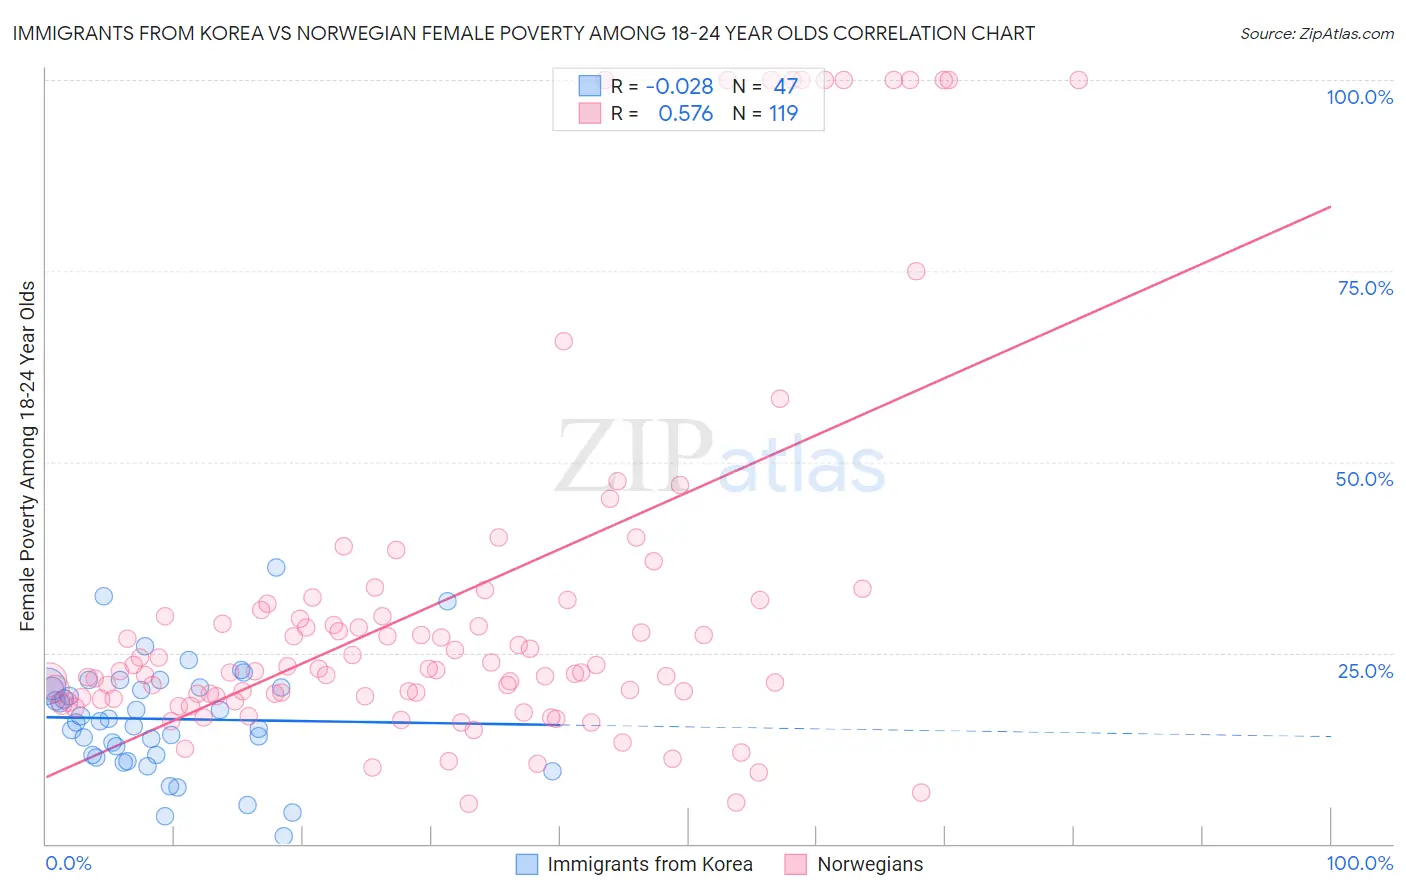
Immigrants from Korea vs Norwegian Female Poverty Among 18-24 Year Olds Correlation Chart
The statistical analysis conducted on geographies consisting of 404,235,363 people shows no correlation between the proportion of Immigrants from Korea and poverty level among females between the ages 18 and 24 in the United States with a correlation coefficient (R) of -0.028 and weighted average of 18.6%. Similarly, the statistical analysis conducted on geographies consisting of 505,664,525 people shows a substantial positive correlation between the proportion of Norwegians and poverty level among females between the ages 18 and 24 in the United States with a correlation coefficient (R) of 0.576 and weighted average of 20.7%, a difference of 11.3%.
Female Poverty Among 18-24 Year Olds Correlation Summary
| Measurement | Immigrants from Korea | Norwegian |
| Minimum | 0.99% | 5.2% |
| Maximum | 36.2% | 100.0% |
| Range | 35.2% | 94.8% |
| Mean | 16.3% | 31.9% |
| Median | 16.0% | 22.7% |
| Interquartile 25% (IQ1) | 11.6% | 19.1% |
| Interquartile 75% (IQ3) | 20.5% | 31.5% |
| Interquartile Range (IQR) | 8.9% | 12.4% |
| Standard Deviation (Sample) | 7.2% | 25.1% |
| Standard Deviation (Population) | 7.2% | 25.0% |
Similar Demographics by Female Poverty Among 18-24 Year Olds
Demographics Similar to Immigrants from Korea by Female Poverty Among 18-24 Year Olds
In terms of female poverty among 18-24 year olds, the demographic groups most similar to Immigrants from Korea are Brazilian (18.6%, a difference of 0.030%), Immigrants from Bulgaria (18.6%, a difference of 0.15%), Jordanian (18.6%, a difference of 0.17%), Immigrants from Costa Rica (18.7%, a difference of 0.26%), and Immigrants from Haiti (18.7%, a difference of 0.32%).
| Demographics | Rating | Rank | Female Poverty Among 18-24 Year Olds |
| Immigrants | Brazil | 99.8 /100 | #60 | Exceptional 18.5% |
| Immigrants | Albania | 99.8 /100 | #61 | Exceptional 18.5% |
| Greeks | 99.8 /100 | #62 | Exceptional 18.5% |
| Immigrants | Belarus | 99.8 /100 | #63 | Exceptional 18.5% |
| Immigrants | Asia | 99.8 /100 | #64 | Exceptional 18.6% |
| Immigrants | Scotland | 99.8 /100 | #65 | Exceptional 18.6% |
| Jordanians | 99.8 /100 | #66 | Exceptional 18.6% |
| Immigrants | Korea | 99.8 /100 | #67 | Exceptional 18.6% |
| Brazilians | 99.8 /100 | #68 | Exceptional 18.6% |
| Immigrants | Bulgaria | 99.7 /100 | #69 | Exceptional 18.6% |
| Immigrants | Costa Rica | 99.7 /100 | #70 | Exceptional 18.7% |
| Immigrants | Haiti | 99.7 /100 | #71 | Exceptional 18.7% |
| Armenians | 99.7 /100 | #72 | Exceptional 18.7% |
| Lithuanians | 99.7 /100 | #73 | Exceptional 18.7% |
| Hawaiians | 99.6 /100 | #74 | Exceptional 18.7% |
Demographics Similar to Norwegians by Female Poverty Among 18-24 Year Olds
In terms of female poverty among 18-24 year olds, the demographic groups most similar to Norwegians are Estonian (20.7%, a difference of 0.020%), Immigrants from Liberia (20.7%, a difference of 0.060%), Immigrants from Sweden (20.7%, a difference of 0.080%), French (20.7%, a difference of 0.11%), and Guatemalan (20.7%, a difference of 0.13%).
| Demographics | Rating | Rank | Female Poverty Among 18-24 Year Olds |
| Immigrants | Nepal | 9.6 /100 | #218 | Tragic 20.7% |
| Immigrants | Micronesia | 9.6 /100 | #219 | Tragic 20.7% |
| British | 9.4 /100 | #220 | Tragic 20.7% |
| Barbadians | 9.0 /100 | #221 | Tragic 20.7% |
| Guatemalans | 8.1 /100 | #222 | Tragic 20.7% |
| French | 7.9 /100 | #223 | Tragic 20.7% |
| Immigrants | Liberia | 7.6 /100 | #224 | Tragic 20.7% |
| Norwegians | 7.3 /100 | #225 | Tragic 20.7% |
| Estonians | 7.2 /100 | #226 | Tragic 20.7% |
| Immigrants | Sweden | 6.8 /100 | #227 | Tragic 20.7% |
| Ghanaians | 6.5 /100 | #228 | Tragic 20.8% |
| Australians | 6.1 /100 | #229 | Tragic 20.8% |
| Whites/Caucasians | 6.1 /100 | #230 | Tragic 20.8% |
| Immigrants | St. Vincent and the Grenadines | 6.0 /100 | #231 | Tragic 20.8% |
| Finns | 6.0 /100 | #232 | Tragic 20.8% |