Immigrants from Korea vs Norwegian 4th Grade
COMPARE
Immigrants from Korea
Norwegian
4th Grade
4th Grade Comparison
Immigrants from Korea
Norwegians
97.5%
4TH GRADE
50.6/ 100
METRIC RATING
173rd/ 347
METRIC RANK
98.5%
4TH GRADE
100.0/ 100
METRIC RATING
6th/ 347
METRIC RANK
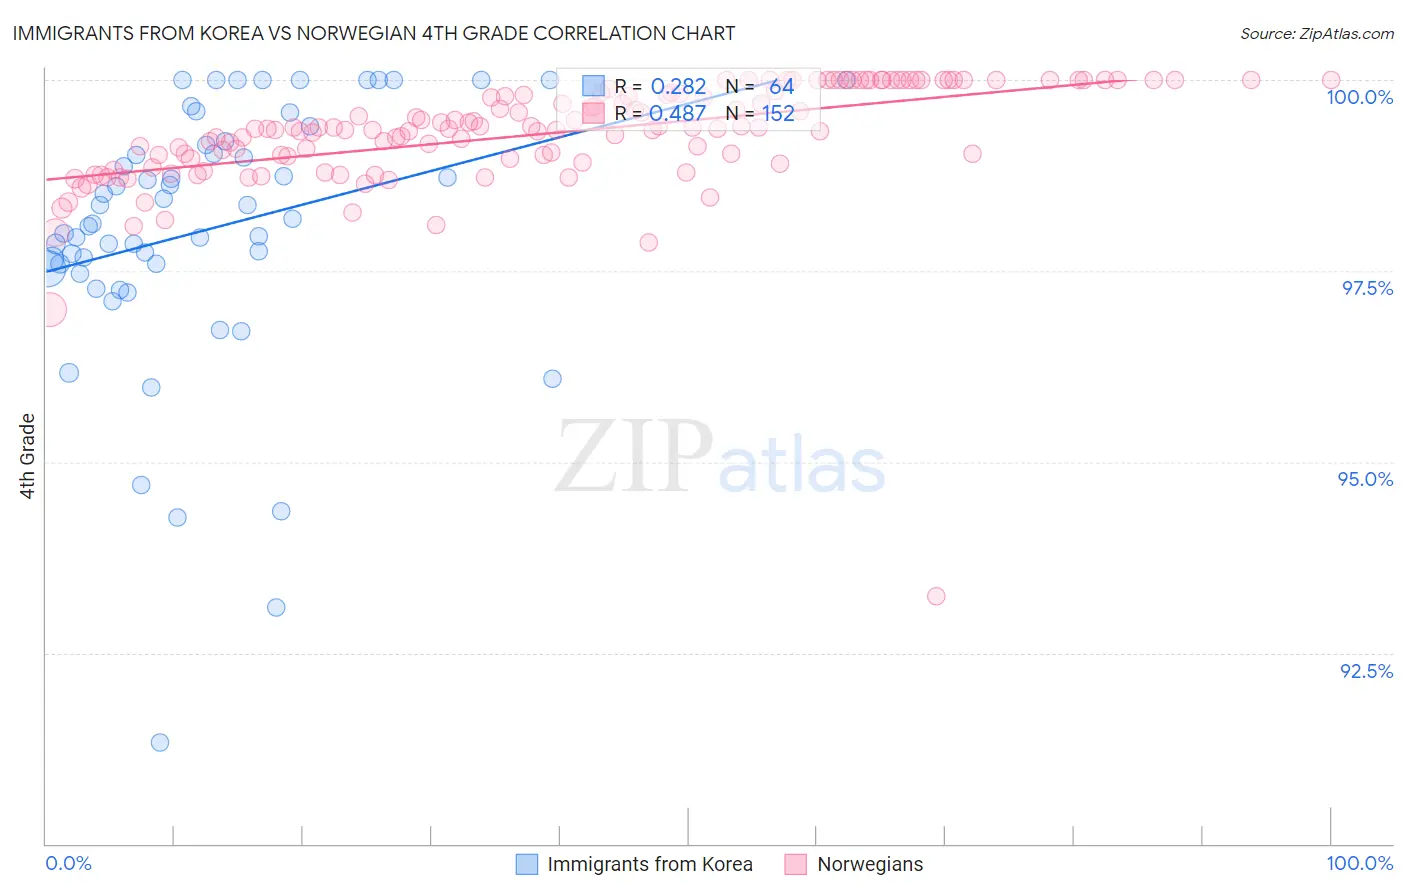
Immigrants from Korea vs Norwegian 4th Grade Correlation Chart
The statistical analysis conducted on geographies consisting of 416,280,076 people shows a weak positive correlation between the proportion of Immigrants from Korea and percentage of population with at least 4th grade education in the United States with a correlation coefficient (R) of 0.282 and weighted average of 97.5%. Similarly, the statistical analysis conducted on geographies consisting of 533,395,488 people shows a moderate positive correlation between the proportion of Norwegians and percentage of population with at least 4th grade education in the United States with a correlation coefficient (R) of 0.487 and weighted average of 98.5%, a difference of 1.0%.
4th Grade Correlation Summary
| Measurement | Immigrants from Korea | Norwegian |
| Minimum | 91.3% | 93.2% |
| Maximum | 100.0% | 100.0% |
| Range | 8.7% | 6.8% |
| Mean | 98.0% | 99.3% |
| Median | 98.1% | 99.4% |
| Interquartile 25% (IQ1) | 97.6% | 99.0% |
| Interquartile 75% (IQ3) | 99.2% | 99.8% |
| Interquartile Range (IQR) | 1.6% | 0.88% |
| Standard Deviation (Sample) | 1.7% | 0.75% |
| Standard Deviation (Population) | 1.7% | 0.75% |
Similar Demographics by 4th Grade
Demographics Similar to Immigrants from Korea by 4th Grade
In terms of 4th grade, the demographic groups most similar to Immigrants from Korea are Immigrants from Spain (97.5%, a difference of 0.0%), Brazilian (97.5%, a difference of 0.0%), Immigrants from Sri Lanka (97.5%, a difference of 0.0%), Egyptian (97.5%, a difference of 0.0%), and Immigrants from Micronesia (97.5%, a difference of 0.0%).
| Demographics | Rating | Rank | 4th Grade |
| Kenyans | 56.5 /100 | #166 | Average 97.5% |
| Immigrants | Poland | 55.9 /100 | #167 | Average 97.5% |
| Immigrants | Belarus | 55.8 /100 | #168 | Average 97.5% |
| Chileans | 54.4 /100 | #169 | Average 97.5% |
| Immigrants | Spain | 51.8 /100 | #170 | Average 97.5% |
| Brazilians | 51.5 /100 | #171 | Average 97.5% |
| Immigrants | Sri Lanka | 51.1 /100 | #172 | Average 97.5% |
| Immigrants | Korea | 50.6 /100 | #173 | Average 97.5% |
| Egyptians | 50.0 /100 | #174 | Average 97.5% |
| Immigrants | Micronesia | 49.6 /100 | #175 | Average 97.5% |
| Arabs | 48.7 /100 | #176 | Average 97.5% |
| Immigrants | Brazil | 46.1 /100 | #177 | Average 97.5% |
| Comanche | 45.3 /100 | #178 | Average 97.5% |
| Immigrants | Kazakhstan | 43.6 /100 | #179 | Average 97.5% |
| Immigrants | Venezuela | 42.7 /100 | #180 | Average 97.5% |
Demographics Similar to Norwegians by 4th Grade
In terms of 4th grade, the demographic groups most similar to Norwegians are Slovak (98.5%, a difference of 0.020%), German (98.5%, a difference of 0.020%), Yup'ik (98.5%, a difference of 0.030%), Inupiat (98.6%, a difference of 0.060%), and Slovene (98.4%, a difference of 0.060%).
| Demographics | Rating | Rank | 4th Grade |
| Crow | 100.0 /100 | #1 | Exceptional 99.6% |
| Welsh | 100.0 /100 | #2 | Exceptional 98.7% |
| Tsimshian | 100.0 /100 | #3 | Exceptional 98.6% |
| Inupiat | 100.0 /100 | #4 | Exceptional 98.6% |
| Yup'ik | 100.0 /100 | #5 | Exceptional 98.5% |
| Norwegians | 100.0 /100 | #6 | Exceptional 98.5% |
| Slovaks | 100.0 /100 | #7 | Exceptional 98.5% |
| Germans | 100.0 /100 | #8 | Exceptional 98.5% |
| Slovenes | 100.0 /100 | #9 | Exceptional 98.4% |
| Alaskan Athabascans | 100.0 /100 | #10 | Exceptional 98.4% |
| English | 100.0 /100 | #11 | Exceptional 98.4% |
| Tlingit-Haida | 100.0 /100 | #12 | Exceptional 98.4% |
| Swedes | 100.0 /100 | #13 | Exceptional 98.4% |
| Carpatho Rusyns | 100.0 /100 | #14 | Exceptional 98.4% |
| Dutch | 100.0 /100 | #15 | Exceptional 98.4% |