Immigrants from Japan vs Immigrants from Iran Female Poverty Among 18-24 Year Olds
COMPARE
Immigrants from Japan
Immigrants from Iran
Female Poverty Among 18-24 Year Olds
Female Poverty Among 18-24 Year Olds Comparison
Immigrants from Japan
Immigrants from Iran
19.8%
FEMALE POVERTY AMONG 18-24 YEAR OLDS
78.1/ 100
METRIC RATING
153rd/ 347
METRIC RANK
19.3%
FEMALE POVERTY AMONG 18-24 YEAR OLDS
95.8/ 100
METRIC RATING
117th/ 347
METRIC RANK
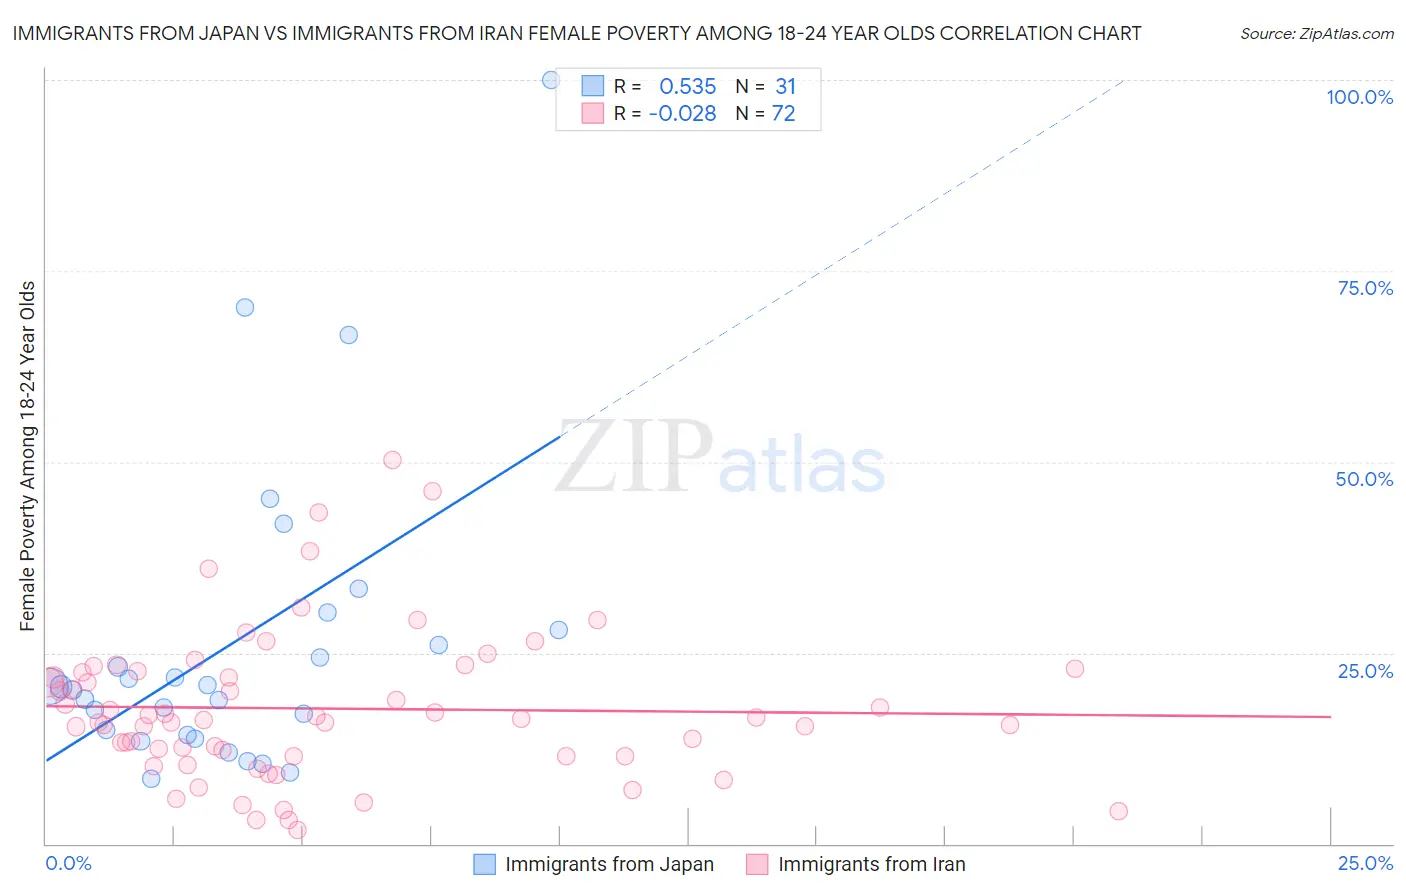
Immigrants from Japan vs Immigrants from Iran Female Poverty Among 18-24 Year Olds Correlation Chart
The statistical analysis conducted on geographies consisting of 334,056,060 people shows a substantial positive correlation between the proportion of Immigrants from Japan and poverty level among females between the ages 18 and 24 in the United States with a correlation coefficient (R) of 0.535 and weighted average of 19.8%. Similarly, the statistical analysis conducted on geographies consisting of 275,233,640 people shows no correlation between the proportion of Immigrants from Iran and poverty level among females between the ages 18 and 24 in the United States with a correlation coefficient (R) of -0.028 and weighted average of 19.3%, a difference of 2.4%.
Female Poverty Among 18-24 Year Olds Correlation Summary
| Measurement | Immigrants from Japan | Immigrants from Iran |
| Minimum | 8.5% | 1.8% |
| Maximum | 100.0% | 50.2% |
| Range | 91.5% | 48.4% |
| Mean | 26.2% | 17.7% |
| Median | 20.6% | 16.3% |
| Interquartile 25% (IQ1) | 14.3% | 11.5% |
| Interquartile 75% (IQ3) | 28.0% | 22.5% |
| Interquartile Range (IQR) | 13.7% | 11.0% |
| Standard Deviation (Sample) | 20.1% | 9.8% |
| Standard Deviation (Population) | 19.7% | 9.7% |
Similar Demographics by Female Poverty Among 18-24 Year Olds
Demographics Similar to Immigrants from Japan by Female Poverty Among 18-24 Year Olds
In terms of female poverty among 18-24 year olds, the demographic groups most similar to Immigrants from Japan are Yugoslavian (19.8%, a difference of 0.060%), Immigrants from Zimbabwe (19.8%, a difference of 0.10%), Hungarian (19.8%, a difference of 0.11%), Immigrants from Eastern Asia (19.8%, a difference of 0.12%), and Immigrants from Belgium (19.8%, a difference of 0.12%).
| Demographics | Rating | Rank | Female Poverty Among 18-24 Year Olds |
| Immigrants | Bosnia and Herzegovina | 83.6 /100 | #146 | Excellent 19.7% |
| Immigrants | Austria | 83.1 /100 | #147 | Excellent 19.7% |
| Immigrants | Latin America | 81.3 /100 | #148 | Excellent 19.7% |
| Immigrants | Oceania | 81.2 /100 | #149 | Excellent 19.7% |
| Syrians | 80.2 /100 | #150 | Excellent 19.8% |
| Immigrants | Eastern Asia | 79.7 /100 | #151 | Good 19.8% |
| Yugoslavians | 79.0 /100 | #152 | Good 19.8% |
| Immigrants | Japan | 78.1 /100 | #153 | Good 19.8% |
| Immigrants | Zimbabwe | 76.7 /100 | #154 | Good 19.8% |
| Hungarians | 76.6 /100 | #155 | Good 19.8% |
| Immigrants | Belgium | 76.4 /100 | #156 | Good 19.8% |
| Danes | 75.5 /100 | #157 | Good 19.8% |
| Immigrants | Lebanon | 75.3 /100 | #158 | Good 19.8% |
| Trinidadians and Tobagonians | 74.4 /100 | #159 | Good 19.8% |
| Pakistanis | 74.1 /100 | #160 | Good 19.8% |
Demographics Similar to Immigrants from Iran by Female Poverty Among 18-24 Year Olds
In terms of female poverty among 18-24 year olds, the demographic groups most similar to Immigrants from Iran are Immigrants (19.3%, a difference of 0.030%), Immigrants from Guyana (19.3%, a difference of 0.060%), Cypriot (19.3%, a difference of 0.070%), Immigrants from Northern Europe (19.4%, a difference of 0.12%), and Immigrants from Hungary (19.3%, a difference of 0.14%).
| Demographics | Rating | Rank | Female Poverty Among 18-24 Year Olds |
| Laotians | 97.1 /100 | #110 | Exceptional 19.2% |
| Immigrants | Serbia | 97.1 /100 | #111 | Exceptional 19.2% |
| Immigrants | El Salvador | 96.5 /100 | #112 | Exceptional 19.3% |
| Immigrants | Cameroon | 96.3 /100 | #113 | Exceptional 19.3% |
| Slovenes | 96.2 /100 | #114 | Exceptional 19.3% |
| Immigrants | Hungary | 96.2 /100 | #115 | Exceptional 19.3% |
| Immigrants | Immigrants | 95.9 /100 | #116 | Exceptional 19.3% |
| Immigrants | Iran | 95.8 /100 | #117 | Exceptional 19.3% |
| Immigrants | Guyana | 95.6 /100 | #118 | Exceptional 19.3% |
| Cypriots | 95.5 /100 | #119 | Exceptional 19.3% |
| Immigrants | Northern Europe | 95.4 /100 | #120 | Exceptional 19.4% |
| Guyanese | 95.3 /100 | #121 | Exceptional 19.4% |
| Cambodians | 94.6 /100 | #122 | Exceptional 19.4% |
| Paraguayans | 94.6 /100 | #123 | Exceptional 19.4% |
| Immigrants | Chile | 94.3 /100 | #124 | Exceptional 19.4% |