Immigrants from Jamaica vs Colombian Poverty
COMPARE
Immigrants from Jamaica
Colombian
Poverty
Poverty Comparison
Immigrants from Jamaica
Colombians
14.4%
POVERTY
0.1/ 100
METRIC RATING
264th/ 347
METRIC RANK
12.2%
POVERTY
57.8/ 100
METRIC RATING
164th/ 347
METRIC RANK
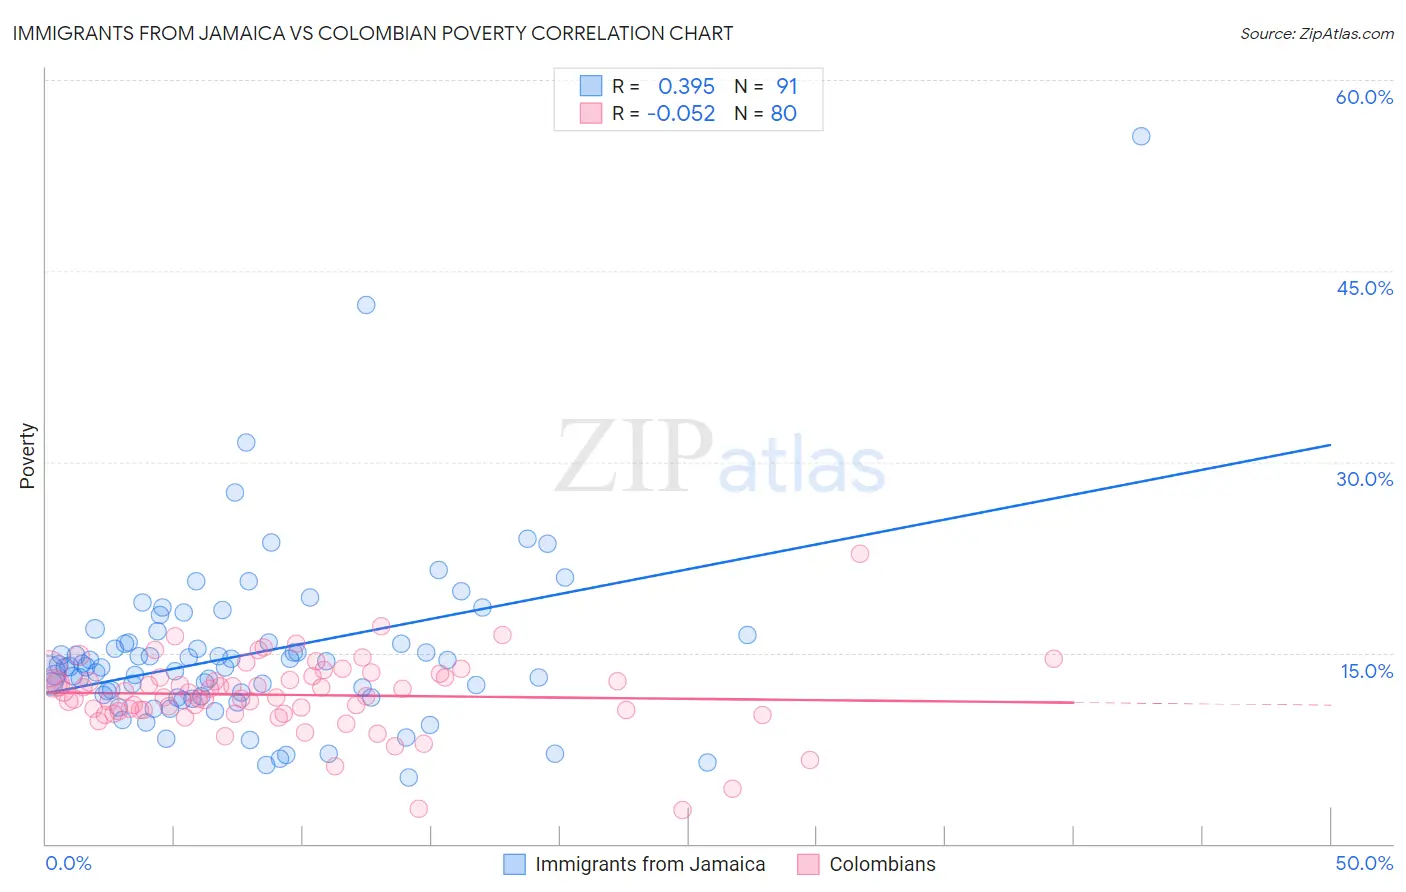
Immigrants from Jamaica vs Colombian Poverty Correlation Chart
The statistical analysis conducted on geographies consisting of 301,608,738 people shows a mild positive correlation between the proportion of Immigrants from Jamaica and poverty level in the United States with a correlation coefficient (R) of 0.395 and weighted average of 14.4%. Similarly, the statistical analysis conducted on geographies consisting of 419,330,126 people shows a slight negative correlation between the proportion of Colombians and poverty level in the United States with a correlation coefficient (R) of -0.052 and weighted average of 12.2%, a difference of 18.1%.
Poverty Correlation Summary
| Measurement | Immigrants from Jamaica | Colombian |
| Minimum | 5.2% | 2.6% |
| Maximum | 55.6% | 22.8% |
| Range | 50.4% | 20.2% |
| Mean | 14.9% | 11.7% |
| Median | 13.9% | 11.7% |
| Interquartile 25% (IQ1) | 11.6% | 10.5% |
| Interquartile 75% (IQ3) | 15.8% | 13.1% |
| Interquartile Range (IQR) | 4.3% | 2.7% |
| Standard Deviation (Sample) | 6.9% | 3.0% |
| Standard Deviation (Population) | 6.9% | 3.0% |
Similar Demographics by Poverty
Demographics Similar to Immigrants from Jamaica by Poverty
In terms of poverty, the demographic groups most similar to Immigrants from Jamaica are Jamaican (14.4%, a difference of 0.090%), Immigrants from Guyana (14.5%, a difference of 0.13%), Guyanese (14.5%, a difference of 0.30%), Immigrants from Liberia (14.4%, a difference of 0.43%), and Cherokee (14.4%, a difference of 0.60%).
| Demographics | Rating | Rank | Poverty |
| Trinidadians and Tobagonians | 0.1 /100 | #257 | Tragic 14.3% |
| Ottawa | 0.1 /100 | #258 | Tragic 14.3% |
| Immigrants | Nicaragua | 0.1 /100 | #259 | Tragic 14.3% |
| Cape Verdeans | 0.1 /100 | #260 | Tragic 14.4% |
| Cherokee | 0.1 /100 | #261 | Tragic 14.4% |
| Immigrants | Liberia | 0.1 /100 | #262 | Tragic 14.4% |
| Jamaicans | 0.1 /100 | #263 | Tragic 14.4% |
| Immigrants | Jamaica | 0.1 /100 | #264 | Tragic 14.4% |
| Immigrants | Guyana | 0.1 /100 | #265 | Tragic 14.5% |
| Guyanese | 0.1 /100 | #266 | Tragic 14.5% |
| Iroquois | 0.1 /100 | #267 | Tragic 14.5% |
| Sub-Saharan Africans | 0.1 /100 | #268 | Tragic 14.5% |
| Immigrants | Cuba | 0.1 /100 | #269 | Tragic 14.6% |
| Central Americans | 0.1 /100 | #270 | Tragic 14.6% |
| Shoshone | 0.0 /100 | #271 | Tragic 14.7% |
Demographics Similar to Colombians by Poverty
In terms of poverty, the demographic groups most similar to Colombians are Immigrants from Albania (12.2%, a difference of 0.010%), Immigrants from Ethiopia (12.2%, a difference of 0.070%), Venezuelan (12.2%, a difference of 0.10%), Immigrants from Chile (12.2%, a difference of 0.11%), and Ethiopian (12.2%, a difference of 0.12%).
| Demographics | Rating | Rank | Poverty |
| Costa Ricans | 62.2 /100 | #157 | Good 12.2% |
| Taiwanese | 61.8 /100 | #158 | Good 12.2% |
| Pennsylvania Germans | 60.8 /100 | #159 | Good 12.2% |
| Immigrants | Nepal | 60.4 /100 | #160 | Good 12.2% |
| Immigrants | Fiji | 59.1 /100 | #161 | Average 12.2% |
| Ethiopians | 59.1 /100 | #162 | Average 12.2% |
| Immigrants | Ethiopia | 58.6 /100 | #163 | Average 12.2% |
| Colombians | 57.8 /100 | #164 | Average 12.2% |
| Immigrants | Albania | 57.7 /100 | #165 | Average 12.2% |
| Venezuelans | 56.9 /100 | #166 | Average 12.2% |
| Immigrants | Chile | 56.7 /100 | #167 | Average 12.2% |
| Immigrants | Venezuela | 56.5 /100 | #168 | Average 12.2% |
| Whites/Caucasians | 55.4 /100 | #169 | Average 12.3% |
| Immigrants | Oceania | 54.6 /100 | #170 | Average 12.3% |
| Immigrants | Spain | 51.3 /100 | #171 | Average 12.3% |