Immigrants from Israel vs Syrian Poverty
COMPARE
Immigrants from Israel
Syrian
Poverty
Poverty Comparison
Immigrants from Israel
Syrians
11.7%
POVERTY
87.4/ 100
METRIC RATING
128th/ 347
METRIC RANK
12.0%
POVERTY
75.1/ 100
METRIC RATING
145th/ 347
METRIC RANK
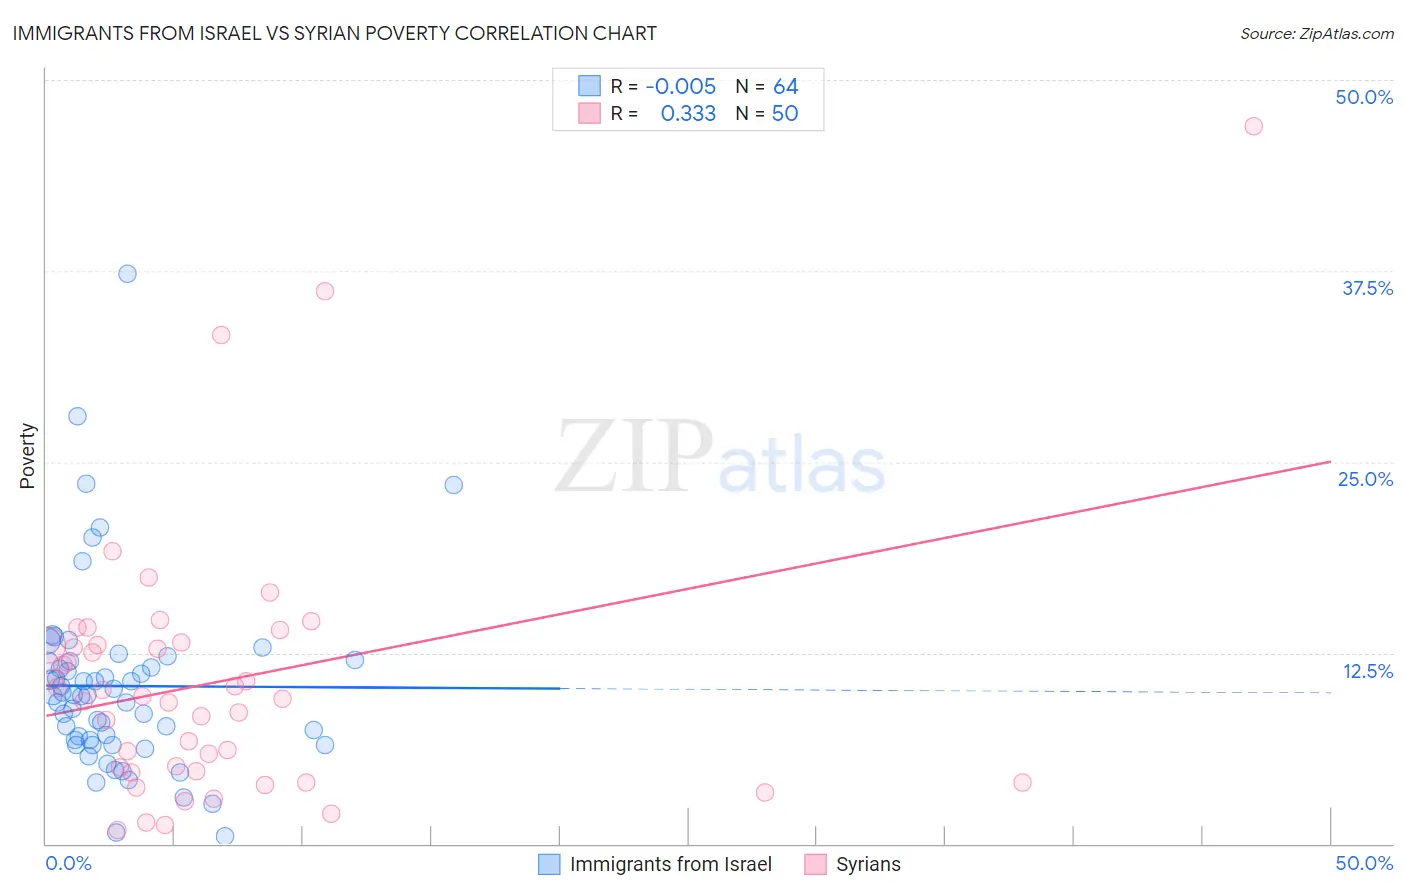
Immigrants from Israel vs Syrian Poverty Correlation Chart
The statistical analysis conducted on geographies consisting of 209,974,563 people shows no correlation between the proportion of Immigrants from Israel and poverty level in the United States with a correlation coefficient (R) of -0.005 and weighted average of 11.7%. Similarly, the statistical analysis conducted on geographies consisting of 266,206,750 people shows a mild positive correlation between the proportion of Syrians and poverty level in the United States with a correlation coefficient (R) of 0.333 and weighted average of 12.0%, a difference of 2.1%.
Poverty Correlation Summary
| Measurement | Immigrants from Israel | Syrian |
| Minimum | 0.47% | 0.89% |
| Maximum | 37.3% | 47.0% |
| Range | 36.8% | 46.1% |
| Mean | 10.3% | 10.6% |
| Median | 9.7% | 9.6% |
| Interquartile 25% (IQ1) | 6.6% | 4.8% |
| Interquartile 75% (IQ3) | 11.9% | 13.0% |
| Interquartile Range (IQR) | 5.2% | 8.3% |
| Standard Deviation (Sample) | 6.2% | 8.7% |
| Standard Deviation (Population) | 6.1% | 8.6% |
Demographics Similar to Immigrants from Israel and Syrians by Poverty
In terms of poverty, the demographic groups most similar to Immigrants from Israel are South African (11.7%, a difference of 0.090%), Immigrants from Argentina (11.7%, a difference of 0.13%), Immigrants from Norway (11.7%, a difference of 0.14%), Immigrants from Ukraine (11.8%, a difference of 0.19%), and French (11.8%, a difference of 0.29%). Similarly, the demographic groups most similar to Syrians are Afghan (12.0%, a difference of 0.030%), Icelander (11.9%, a difference of 0.38%), Brazilian (11.9%, a difference of 0.66%), Basque (11.9%, a difference of 0.77%), and Immigrants from France (11.9%, a difference of 0.78%).
| Demographics | Rating | Rank | Poverty |
| Immigrants | Norway | 88.0 /100 | #126 | Excellent 11.7% |
| Immigrants | Argentina | 88.0 /100 | #127 | Excellent 11.7% |
| Immigrants | Israel | 87.4 /100 | #128 | Excellent 11.7% |
| South Africans | 87.0 /100 | #129 | Excellent 11.7% |
| Immigrants | Ukraine | 86.6 /100 | #130 | Excellent 11.8% |
| French | 86.1 /100 | #131 | Excellent 11.8% |
| Peruvians | 85.6 /100 | #132 | Excellent 11.8% |
| Immigrants | Western Europe | 85.2 /100 | #133 | Excellent 11.8% |
| Yugoslavians | 85.2 /100 | #134 | Excellent 11.8% |
| Immigrants | Vietnam | 85.2 /100 | #135 | Excellent 11.8% |
| Chileans | 84.2 /100 | #136 | Excellent 11.8% |
| Immigrants | Switzerland | 83.0 /100 | #137 | Excellent 11.8% |
| Immigrants | Jordan | 82.4 /100 | #138 | Excellent 11.9% |
| Pakistanis | 82.2 /100 | #139 | Excellent 11.9% |
| Immigrants | Peru | 81.1 /100 | #140 | Excellent 11.9% |
| Immigrants | France | 80.5 /100 | #141 | Excellent 11.9% |
| Basques | 80.4 /100 | #142 | Excellent 11.9% |
| Brazilians | 79.7 /100 | #143 | Good 11.9% |
| Icelanders | 77.9 /100 | #144 | Good 11.9% |
| Syrians | 75.1 /100 | #145 | Good 12.0% |
| Afghans | 74.9 /100 | #146 | Good 12.0% |