Immigrants from Iraq vs Marshallese Child Poverty Under the Age of 5
COMPARE
Immigrants from Iraq
Marshallese
Child Poverty Under the Age of 5
Child Poverty Under the Age of 5 Comparison
Immigrants from Iraq
Marshallese
17.3%
CHILD POVERTY UNDER THE AGE OF 5
45.2/ 100
METRIC RATING
176th/ 347
METRIC RANK
19.7%
CHILD POVERTY UNDER THE AGE OF 5
0.4/ 100
METRIC RATING
248th/ 347
METRIC RANK
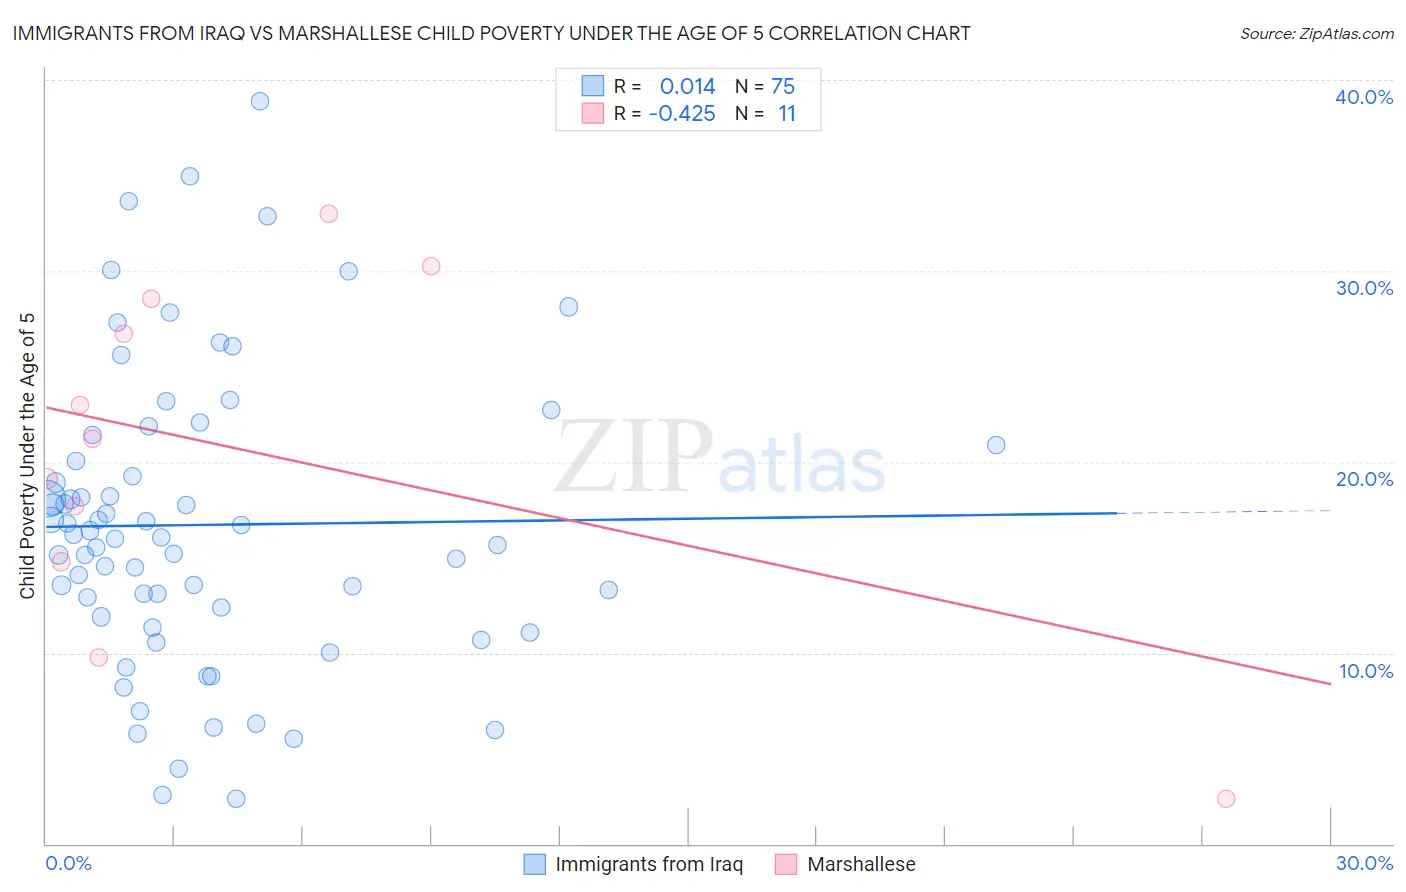
Immigrants from Iraq vs Marshallese Child Poverty Under the Age of 5 Correlation Chart
The statistical analysis conducted on geographies consisting of 190,454,654 people shows no correlation between the proportion of Immigrants from Iraq and poverty level among children under the age of 5 in the United States with a correlation coefficient (R) of 0.014 and weighted average of 17.3%. Similarly, the statistical analysis conducted on geographies consisting of 14,701,855 people shows a moderate negative correlation between the proportion of Marshallese and poverty level among children under the age of 5 in the United States with a correlation coefficient (R) of -0.425 and weighted average of 19.7%, a difference of 13.9%.
Child Poverty Under the Age of 5 Correlation Summary
| Measurement | Immigrants from Iraq | Marshallese |
| Minimum | 2.4% | 2.4% |
| Maximum | 38.9% | 33.0% |
| Range | 36.5% | 30.6% |
| Mean | 16.7% | 20.6% |
| Median | 16.0% | 21.2% |
| Interquartile 25% (IQ1) | 11.9% | 14.8% |
| Interquartile 75% (IQ3) | 20.9% | 28.6% |
| Interquartile Range (IQR) | 9.0% | 13.8% |
| Standard Deviation (Sample) | 7.7% | 9.2% |
| Standard Deviation (Population) | 7.7% | 8.8% |
Similar Demographics by Child Poverty Under the Age of 5
Demographics Similar to Immigrants from Iraq by Child Poverty Under the Age of 5
In terms of child poverty under the age of 5, the demographic groups most similar to Immigrants from Iraq are Immigrants from Sierra Leone (17.3%, a difference of 0.16%), Immigrants from Lebanon (17.3%, a difference of 0.25%), Immigrants from Cameroon (17.4%, a difference of 0.26%), Hawaiian (17.4%, a difference of 0.39%), and South American Indian (17.4%, a difference of 0.40%).
| Demographics | Rating | Rank | Child Poverty Under the Age of 5 |
| Immigrants | South America | 60.0 /100 | #169 | Good 17.1% |
| Immigrants | Western Asia | 59.2 /100 | #170 | Average 17.1% |
| Immigrants | Morocco | 58.9 /100 | #171 | Average 17.1% |
| Yugoslavians | 54.1 /100 | #172 | Average 17.2% |
| Welsh | 54.0 /100 | #173 | Average 17.2% |
| Immigrants | Saudi Arabia | 50.0 /100 | #174 | Average 17.2% |
| Immigrants | Lebanon | 47.6 /100 | #175 | Average 17.3% |
| Immigrants | Iraq | 45.2 /100 | #176 | Average 17.3% |
| Immigrants | Sierra Leone | 43.6 /100 | #177 | Average 17.3% |
| Immigrants | Cameroon | 42.7 /100 | #178 | Average 17.4% |
| Hawaiians | 41.5 /100 | #179 | Average 17.4% |
| South American Indians | 41.4 /100 | #180 | Average 17.4% |
| Immigrants | Germany | 41.0 /100 | #181 | Average 17.4% |
| Arabs | 40.7 /100 | #182 | Average 17.4% |
| Lebanese | 40.3 /100 | #183 | Average 17.4% |
Demographics Similar to Marshallese by Child Poverty Under the Age of 5
In terms of child poverty under the age of 5, the demographic groups most similar to Marshallese are Guyanese (19.7%, a difference of 0.010%), Immigrants from Middle Africa (19.7%, a difference of 0.020%), Nonimmigrants (19.7%, a difference of 0.070%), Cree (19.7%, a difference of 0.17%), and Pennsylvania German (19.8%, a difference of 0.24%).
| Demographics | Rating | Rank | Child Poverty Under the Age of 5 |
| Alaska Natives | 0.5 /100 | #241 | Tragic 19.6% |
| Immigrants | Guyana | 0.5 /100 | #242 | Tragic 19.6% |
| Osage | 0.5 /100 | #243 | Tragic 19.6% |
| Immigrants | Ghana | 0.5 /100 | #244 | Tragic 19.6% |
| Immigrants | Western Africa | 0.4 /100 | #245 | Tragic 19.7% |
| Cree | 0.4 /100 | #246 | Tragic 19.7% |
| Guyanese | 0.4 /100 | #247 | Tragic 19.7% |
| Marshallese | 0.4 /100 | #248 | Tragic 19.7% |
| Immigrants | Middle Africa | 0.4 /100 | #249 | Tragic 19.7% |
| Immigrants | Nonimmigrants | 0.4 /100 | #250 | Tragic 19.7% |
| Pennsylvania Germans | 0.3 /100 | #251 | Tragic 19.8% |
| Immigrants | Nicaragua | 0.3 /100 | #252 | Tragic 19.8% |
| Mexican American Indians | 0.3 /100 | #253 | Tragic 19.9% |
| Fijians | 0.3 /100 | #254 | Tragic 19.9% |
| Immigrants | Cuba | 0.2 /100 | #255 | Tragic 19.9% |