Immigrants from Iraq vs Afghan Child Poverty Under the Age of 5
COMPARE
Immigrants from Iraq
Afghan
Child Poverty Under the Age of 5
Child Poverty Under the Age of 5 Comparison
Immigrants from Iraq
Afghans
17.3%
CHILD POVERTY UNDER THE AGE OF 5
45.2/ 100
METRIC RATING
176th/ 347
METRIC RANK
16.8%
CHILD POVERTY UNDER THE AGE OF 5
74.4/ 100
METRIC RATING
156th/ 347
METRIC RANK
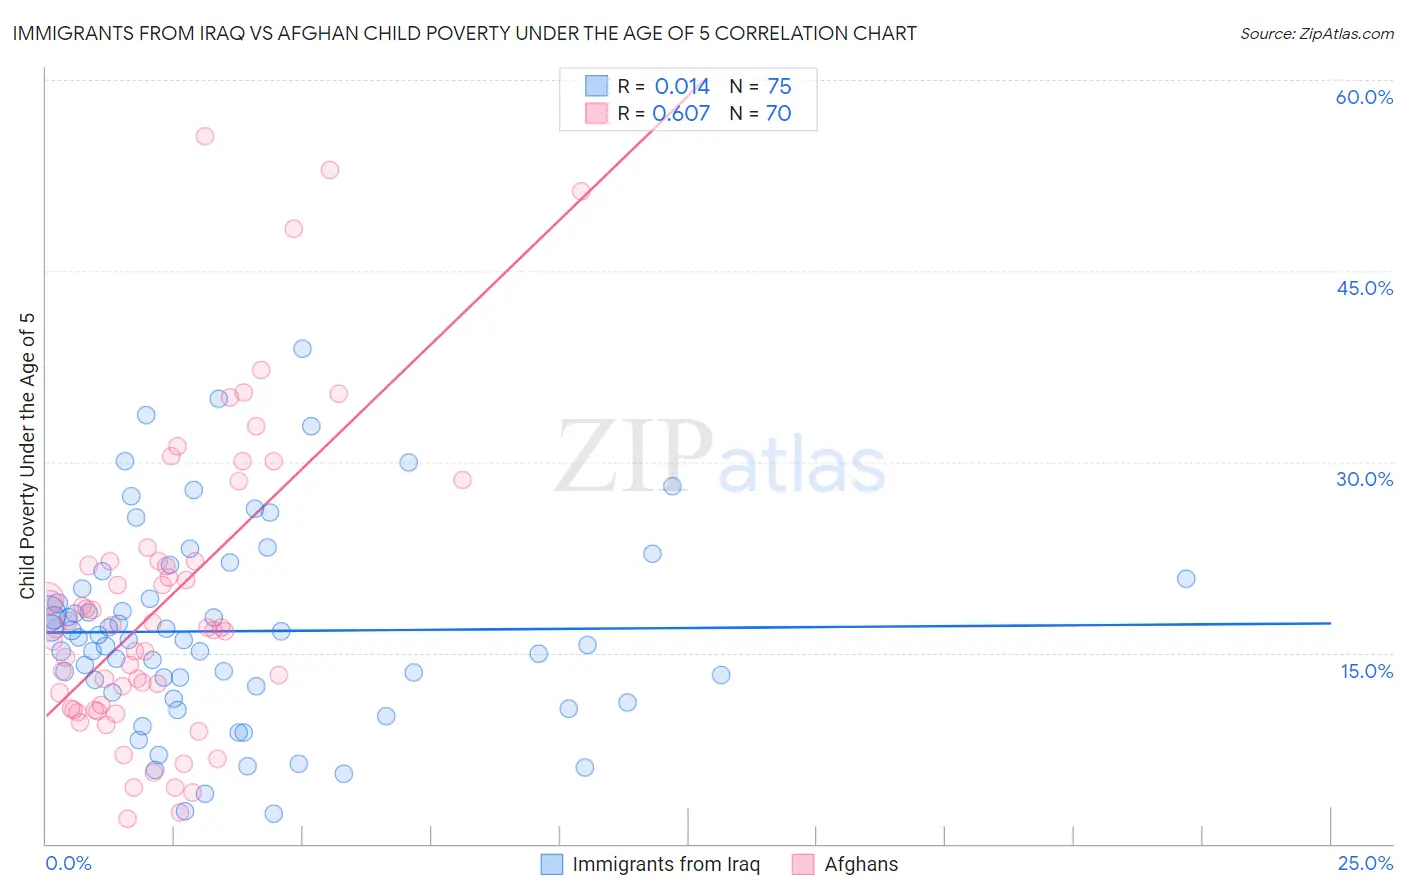
Immigrants from Iraq vs Afghan Child Poverty Under the Age of 5 Correlation Chart
The statistical analysis conducted on geographies consisting of 190,454,654 people shows no correlation between the proportion of Immigrants from Iraq and poverty level among children under the age of 5 in the United States with a correlation coefficient (R) of 0.014 and weighted average of 17.3%. Similarly, the statistical analysis conducted on geographies consisting of 146,489,297 people shows a significant positive correlation between the proportion of Afghans and poverty level among children under the age of 5 in the United States with a correlation coefficient (R) of 0.607 and weighted average of 16.8%, a difference of 3.4%.
Child Poverty Under the Age of 5 Correlation Summary
| Measurement | Immigrants from Iraq | Afghan |
| Minimum | 2.4% | 2.0% |
| Maximum | 38.9% | 55.6% |
| Range | 36.5% | 53.6% |
| Mean | 16.7% | 19.0% |
| Median | 16.0% | 16.9% |
| Interquartile 25% (IQ1) | 11.9% | 10.6% |
| Interquartile 75% (IQ3) | 20.9% | 22.2% |
| Interquartile Range (IQR) | 9.0% | 11.6% |
| Standard Deviation (Sample) | 7.7% | 11.8% |
| Standard Deviation (Population) | 7.7% | 11.7% |
Demographics Similar to Immigrants from Iraq and Afghans by Child Poverty Under the Age of 5
In terms of child poverty under the age of 5, the demographic groups most similar to Immigrants from Iraq are Immigrants from Lebanon (17.3%, a difference of 0.25%), Immigrants from Saudi Arabia (17.2%, a difference of 0.50%), Welsh (17.2%, a difference of 0.92%), Yugoslavian (17.2%, a difference of 0.94%), and Immigrants from Morocco (17.1%, a difference of 1.5%). Similarly, the demographic groups most similar to Afghans are Venezuelan (16.8%, a difference of 0.090%), Czechoslovakian (16.8%, a difference of 0.26%), Immigrants from Syria (16.8%, a difference of 0.29%), Irish (16.8%, a difference of 0.32%), and English (16.8%, a difference of 0.54%).
| Demographics | Rating | Rank | Child Poverty Under the Age of 5 |
| Afghans | 74.4 /100 | #156 | Good 16.8% |
| Venezuelans | 73.7 /100 | #157 | Good 16.8% |
| Czechoslovakians | 72.5 /100 | #158 | Good 16.8% |
| Immigrants | Syria | 72.3 /100 | #159 | Good 16.8% |
| Irish | 72.0 /100 | #160 | Good 16.8% |
| English | 70.4 /100 | #161 | Good 16.8% |
| Costa Ricans | 69.8 /100 | #162 | Good 16.9% |
| Scottish | 68.6 /100 | #163 | Good 16.9% |
| Immigrants | Oceania | 67.6 /100 | #164 | Good 16.9% |
| Immigrants | Colombia | 66.9 /100 | #165 | Good 16.9% |
| Slavs | 64.0 /100 | #166 | Good 17.0% |
| Immigrants | Uzbekistan | 62.0 /100 | #167 | Good 17.0% |
| Uruguayans | 60.5 /100 | #168 | Good 17.0% |
| Immigrants | South America | 60.0 /100 | #169 | Good 17.1% |
| Immigrants | Western Asia | 59.2 /100 | #170 | Average 17.1% |
| Immigrants | Morocco | 58.9 /100 | #171 | Average 17.1% |
| Yugoslavians | 54.1 /100 | #172 | Average 17.2% |
| Welsh | 54.0 /100 | #173 | Average 17.2% |
| Immigrants | Saudi Arabia | 50.0 /100 | #174 | Average 17.2% |
| Immigrants | Lebanon | 47.6 /100 | #175 | Average 17.3% |
| Immigrants | Iraq | 45.2 /100 | #176 | Average 17.3% |