Immigrants from Iran vs Puget Sound Salish Child Poverty Among Girls Under 16
COMPARE
Immigrants from Iran
Puget Sound Salish
Child Poverty Among Girls Under 16
Child Poverty Among Girls Under 16 Comparison
Immigrants from Iran
Puget Sound Salish
12.6%
CHILD POVERTY AMONG GIRLS UNDER 16
100.0/ 100
METRIC RATING
10th/ 347
METRIC RANK
15.4%
CHILD POVERTY AMONG GIRLS UNDER 16
90.1/ 100
METRIC RATING
130th/ 347
METRIC RANK
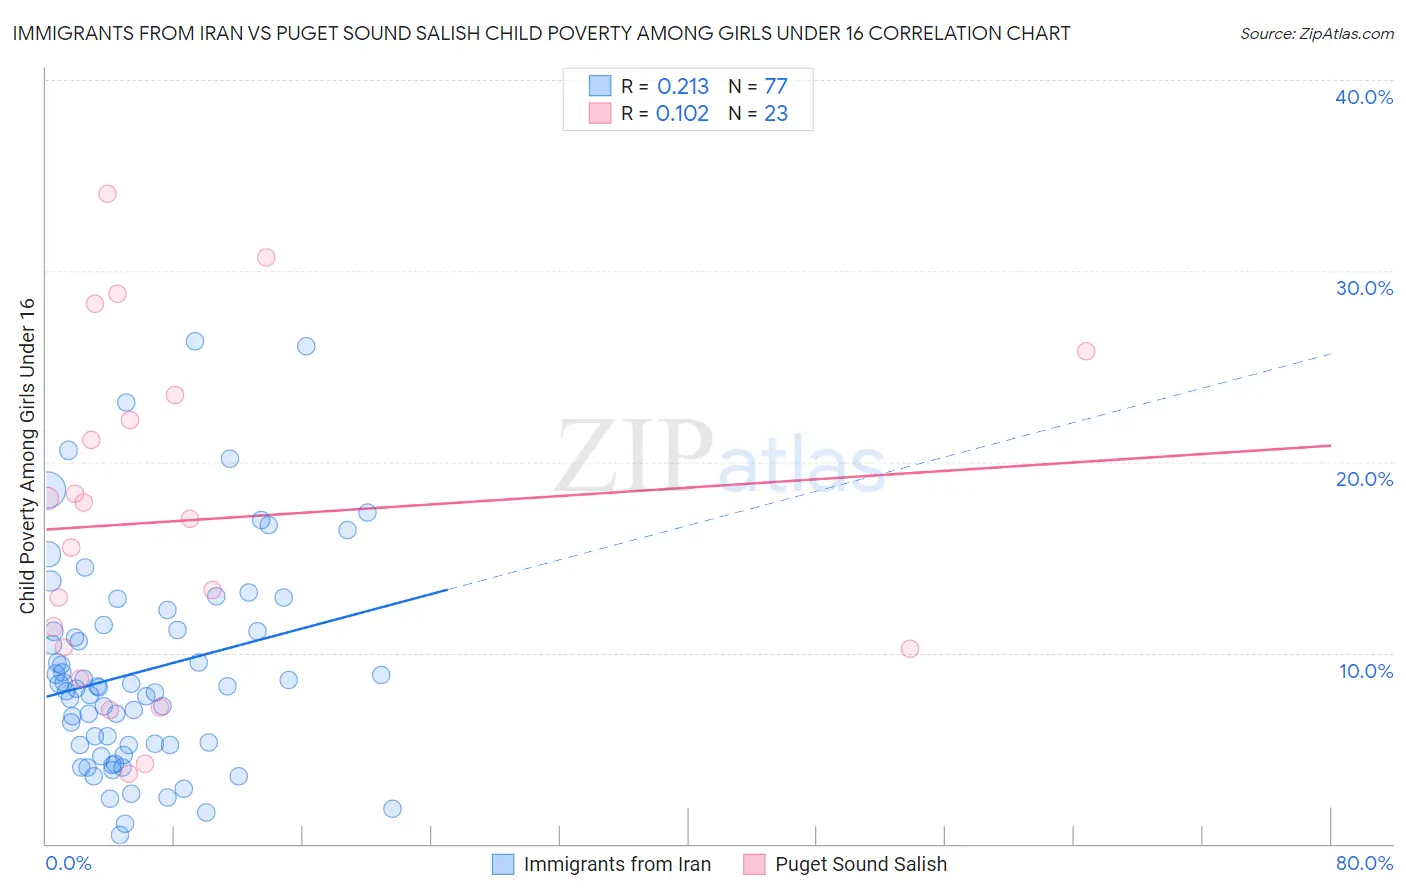
Immigrants from Iran vs Puget Sound Salish Child Poverty Among Girls Under 16 Correlation Chart
The statistical analysis conducted on geographies consisting of 275,647,005 people shows a weak positive correlation between the proportion of Immigrants from Iran and poverty level among girls under the age of 16 in the United States with a correlation coefficient (R) of 0.213 and weighted average of 12.6%. Similarly, the statistical analysis conducted on geographies consisting of 45,926,658 people shows a poor positive correlation between the proportion of Puget Sound Salish and poverty level among girls under the age of 16 in the United States with a correlation coefficient (R) of 0.102 and weighted average of 15.4%, a difference of 22.6%.
Child Poverty Among Girls Under 16 Correlation Summary
| Measurement | Immigrants from Iran | Puget Sound Salish |
| Minimum | 0.46% | 3.7% |
| Maximum | 26.3% | 34.1% |
| Range | 25.9% | 30.4% |
| Mean | 9.0% | 17.0% |
| Median | 8.2% | 17.0% |
| Interquartile 25% (IQ1) | 5.2% | 10.2% |
| Interquartile 75% (IQ3) | 11.3% | 23.5% |
| Interquartile Range (IQR) | 6.2% | 13.3% |
| Standard Deviation (Sample) | 5.6% | 8.7% |
| Standard Deviation (Population) | 5.6% | 8.5% |
Similar Demographics by Child Poverty Among Girls Under 16
Demographics Similar to Immigrants from Iran by Child Poverty Among Girls Under 16
In terms of child poverty among girls under 16, the demographic groups most similar to Immigrants from Iran are Immigrants from Singapore (12.5%, a difference of 0.94%), Immigrants from South Central Asia (12.7%, a difference of 1.3%), Bhutanese (12.7%, a difference of 1.3%), Iranian (12.4%, a difference of 1.4%), and Chinese (12.3%, a difference of 1.9%).
| Demographics | Rating | Rank | Child Poverty Among Girls Under 16 |
| Filipinos | 100.0 /100 | #3 | Exceptional 11.4% |
| Tsimshian | 100.0 /100 | #4 | Exceptional 11.5% |
| Thais | 100.0 /100 | #5 | Exceptional 11.8% |
| Immigrants | Hong Kong | 100.0 /100 | #6 | Exceptional 12.3% |
| Chinese | 100.0 /100 | #7 | Exceptional 12.3% |
| Iranians | 100.0 /100 | #8 | Exceptional 12.4% |
| Immigrants | Singapore | 100.0 /100 | #9 | Exceptional 12.5% |
| Immigrants | Iran | 100.0 /100 | #10 | Exceptional 12.6% |
| Immigrants | South Central Asia | 100.0 /100 | #11 | Exceptional 12.7% |
| Bhutanese | 100.0 /100 | #12 | Exceptional 12.7% |
| Immigrants | Ireland | 99.9 /100 | #13 | Exceptional 12.9% |
| Burmese | 99.9 /100 | #14 | Exceptional 13.0% |
| Okinawans | 99.9 /100 | #15 | Exceptional 13.0% |
| Immigrants | Lithuania | 99.9 /100 | #16 | Exceptional 13.1% |
| Bulgarians | 99.9 /100 | #17 | Exceptional 13.1% |
Demographics Similar to Puget Sound Salish by Child Poverty Among Girls Under 16
In terms of child poverty among girls under 16, the demographic groups most similar to Puget Sound Salish are Immigrants from Western Europe (15.4%, a difference of 0.020%), Mongolian (15.4%, a difference of 0.13%), Brazilian (15.4%, a difference of 0.15%), Immigrants from South Eastern Asia (15.4%, a difference of 0.16%), and Albanian (15.4%, a difference of 0.17%).
| Demographics | Rating | Rank | Child Poverty Among Girls Under 16 |
| Irish | 91.5 /100 | #123 | Exceptional 15.3% |
| Carpatho Rusyns | 91.4 /100 | #124 | Exceptional 15.3% |
| Peruvians | 91.2 /100 | #125 | Exceptional 15.4% |
| Scottish | 91.0 /100 | #126 | Exceptional 15.4% |
| Immigrants | Norway | 90.8 /100 | #127 | Exceptional 15.4% |
| Albanians | 90.5 /100 | #128 | Exceptional 15.4% |
| Immigrants | South Eastern Asia | 90.5 /100 | #129 | Exceptional 15.4% |
| Puget Sound Salish | 90.1 /100 | #130 | Exceptional 15.4% |
| Immigrants | Western Europe | 90.0 /100 | #131 | Exceptional 15.4% |
| Mongolians | 89.7 /100 | #132 | Excellent 15.4% |
| Brazilians | 89.6 /100 | #133 | Excellent 15.4% |
| Immigrants | Spain | 89.1 /100 | #134 | Excellent 15.5% |
| Czechoslovakians | 89.0 /100 | #135 | Excellent 15.5% |
| Native Hawaiians | 89.0 /100 | #136 | Excellent 15.5% |
| South Africans | 88.7 /100 | #137 | Excellent 15.5% |