Immigrants from Honduras vs Austrian Poverty
COMPARE
Immigrants from Honduras
Austrian
Poverty
Poverty Comparison
Immigrants from Honduras
Austrians
16.2%
POVERTY
0.0/ 100
METRIC RATING
320th/ 347
METRIC RANK
11.2%
POVERTY
97.8/ 100
METRIC RATING
62nd/ 347
METRIC RANK
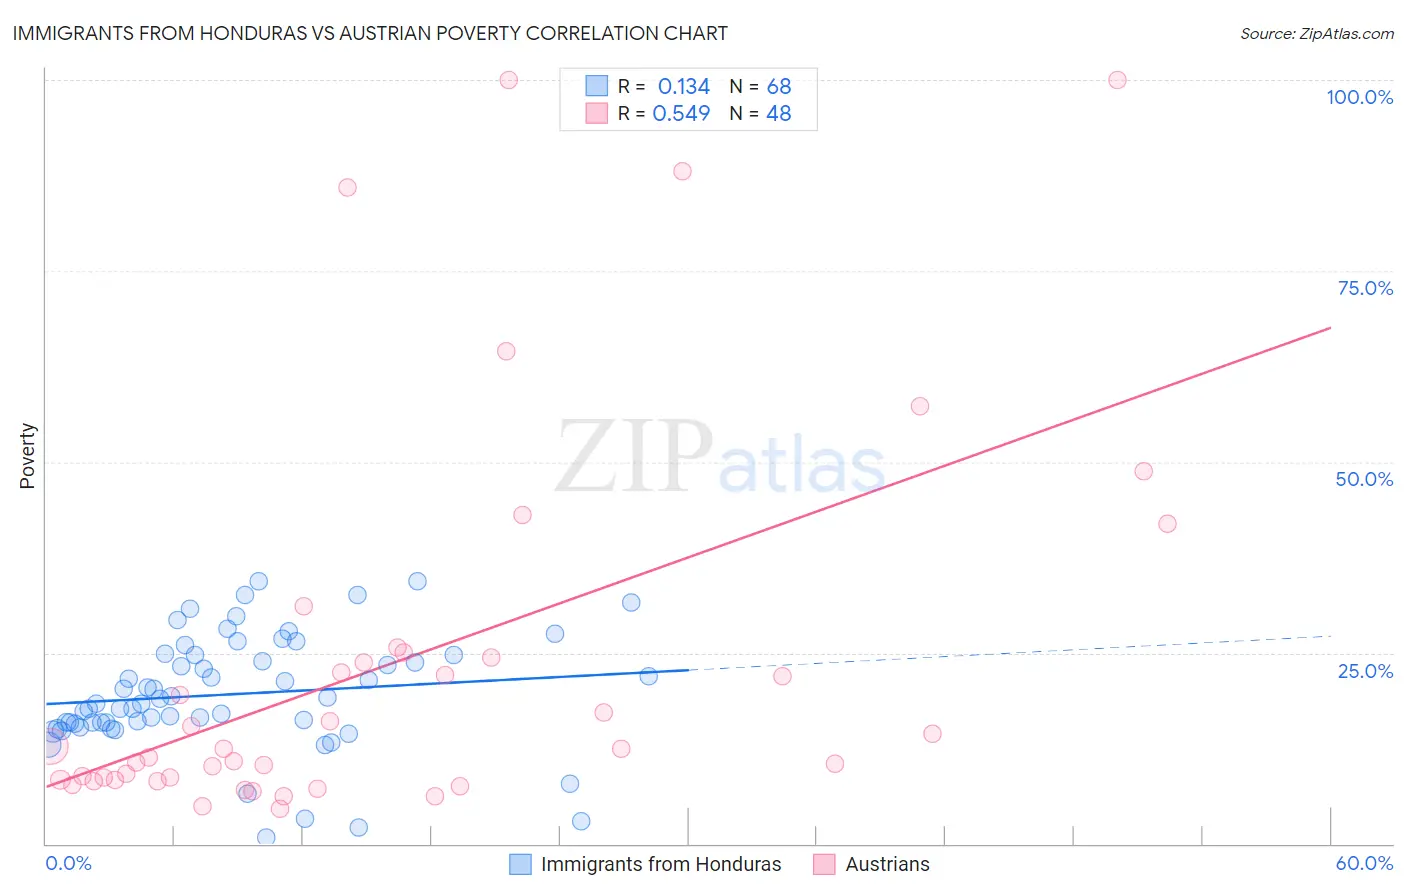
Immigrants from Honduras vs Austrian Poverty Correlation Chart
The statistical analysis conducted on geographies consisting of 322,477,641 people shows a poor positive correlation between the proportion of Immigrants from Honduras and poverty level in the United States with a correlation coefficient (R) of 0.134 and weighted average of 16.2%. Similarly, the statistical analysis conducted on geographies consisting of 451,775,249 people shows a substantial positive correlation between the proportion of Austrians and poverty level in the United States with a correlation coefficient (R) of 0.549 and weighted average of 11.2%, a difference of 44.6%.
Poverty Correlation Summary
| Measurement | Immigrants from Honduras | Austrian |
| Minimum | 0.89% | 4.6% |
| Maximum | 34.4% | 100.0% |
| Range | 33.5% | 95.4% |
| Mean | 19.6% | 23.7% |
| Median | 18.7% | 12.5% |
| Interquartile 25% (IQ1) | 15.7% | 8.4% |
| Interquartile 75% (IQ3) | 24.7% | 24.7% |
| Interquartile Range (IQR) | 9.0% | 16.3% |
| Standard Deviation (Sample) | 7.5% | 25.3% |
| Standard Deviation (Population) | 7.4% | 25.0% |
Similar Demographics by Poverty
Demographics Similar to Immigrants from Honduras by Poverty
In terms of poverty, the demographic groups most similar to Immigrants from Honduras are Immigrants from Congo (16.1%, a difference of 0.23%), Immigrants from Dominica (16.1%, a difference of 0.43%), U.S. Virgin Islander (16.1%, a difference of 0.72%), Arapaho (16.3%, a difference of 0.74%), and Menominee (16.4%, a difference of 1.7%).
| Demographics | Rating | Rank | Poverty |
| Immigrants | Grenada | 0.0 /100 | #313 | Tragic 15.8% |
| Immigrants | Somalia | 0.0 /100 | #314 | Tragic 15.8% |
| British West Indians | 0.0 /100 | #315 | Tragic 15.9% |
| Hondurans | 0.0 /100 | #316 | Tragic 15.9% |
| U.S. Virgin Islanders | 0.0 /100 | #317 | Tragic 16.1% |
| Immigrants | Dominica | 0.0 /100 | #318 | Tragic 16.1% |
| Immigrants | Congo | 0.0 /100 | #319 | Tragic 16.1% |
| Immigrants | Honduras | 0.0 /100 | #320 | Tragic 16.2% |
| Arapaho | 0.0 /100 | #321 | Tragic 16.3% |
| Menominee | 0.0 /100 | #322 | Tragic 16.4% |
| Colville | 0.0 /100 | #323 | Tragic 16.6% |
| Yakama | 0.0 /100 | #324 | Tragic 16.7% |
| Central American Indians | 0.0 /100 | #325 | Tragic 16.7% |
| Paiute | 0.0 /100 | #326 | Tragic 16.7% |
| Kiowa | 0.0 /100 | #327 | Tragic 16.8% |
Demographics Similar to Austrians by Poverty
In terms of poverty, the demographic groups most similar to Austrians are Ukrainian (11.2%, a difference of 0.0%), Immigrants from Italy (11.2%, a difference of 0.030%), Immigrants from Sri Lanka (11.2%, a difference of 0.10%), Swiss (11.2%, a difference of 0.22%), and Immigrants from Europe (11.2%, a difference of 0.26%).
| Demographics | Rating | Rank | Poverty |
| Immigrants | Serbia | 98.5 /100 | #55 | Exceptional 11.1% |
| Estonians | 98.2 /100 | #56 | Exceptional 11.1% |
| Scandinavians | 98.2 /100 | #57 | Exceptional 11.1% |
| Germans | 98.1 /100 | #58 | Exceptional 11.1% |
| Immigrants | Europe | 98.0 /100 | #59 | Exceptional 11.2% |
| Immigrants | Sri Lanka | 97.9 /100 | #60 | Exceptional 11.2% |
| Immigrants | Italy | 97.9 /100 | #61 | Exceptional 11.2% |
| Austrians | 97.8 /100 | #62 | Exceptional 11.2% |
| Ukrainians | 97.8 /100 | #63 | Exceptional 11.2% |
| Swiss | 97.7 /100 | #64 | Exceptional 11.2% |
| Immigrants | Asia | 97.5 /100 | #65 | Exceptional 11.2% |
| Immigrants | Netherlands | 97.5 /100 | #66 | Exceptional 11.2% |
| Immigrants | Australia | 97.4 /100 | #67 | Exceptional 11.2% |
| Slovaks | 97.4 /100 | #68 | Exceptional 11.2% |
| Serbians | 97.4 /100 | #69 | Exceptional 11.2% |