Immigrants from Honduras vs South American Indian Poverty
COMPARE
Immigrants from Honduras
South American Indian
Poverty
Poverty Comparison
Immigrants from Honduras
South American Indians
16.2%
POVERTY
0.0/ 100
METRIC RATING
320th/ 347
METRIC RANK
12.7%
POVERTY
23.3/ 100
METRIC RATING
192nd/ 347
METRIC RANK
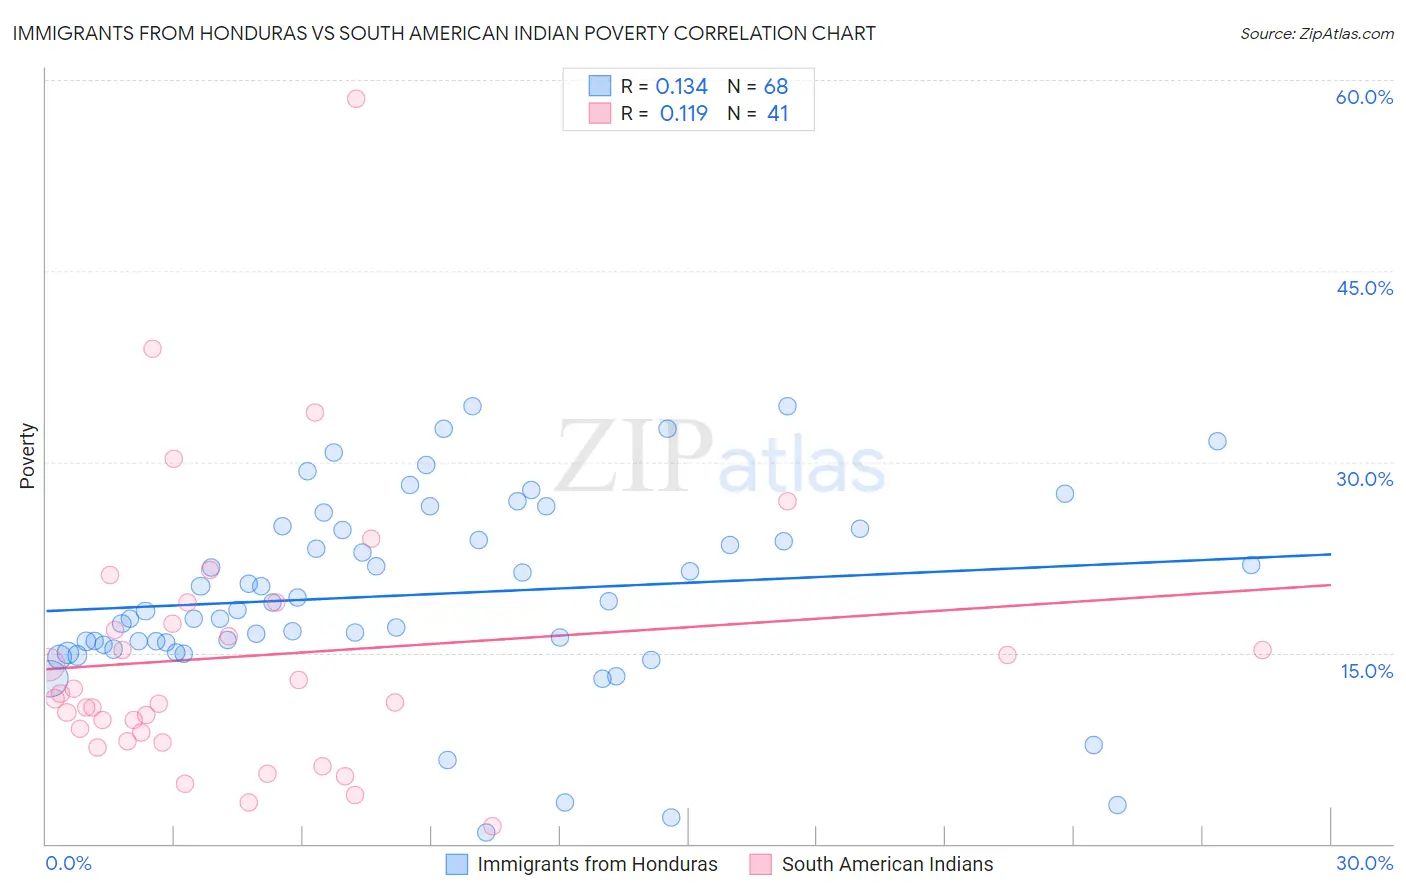
Immigrants from Honduras vs South American Indian Poverty Correlation Chart
The statistical analysis conducted on geographies consisting of 322,477,641 people shows a poor positive correlation between the proportion of Immigrants from Honduras and poverty level in the United States with a correlation coefficient (R) of 0.134 and weighted average of 16.2%. Similarly, the statistical analysis conducted on geographies consisting of 164,528,335 people shows a poor positive correlation between the proportion of South American Indians and poverty level in the United States with a correlation coefficient (R) of 0.119 and weighted average of 12.7%, a difference of 27.6%.
Poverty Correlation Summary
| Measurement | Immigrants from Honduras | South American Indian |
| Minimum | 0.89% | 1.4% |
| Maximum | 34.4% | 58.5% |
| Range | 33.5% | 57.1% |
| Mean | 19.6% | 14.8% |
| Median | 18.7% | 11.4% |
| Interquartile 25% (IQ1) | 15.7% | 8.4% |
| Interquartile 75% (IQ3) | 24.7% | 18.2% |
| Interquartile Range (IQR) | 9.0% | 9.8% |
| Standard Deviation (Sample) | 7.5% | 10.8% |
| Standard Deviation (Population) | 7.4% | 10.6% |
Similar Demographics by Poverty
Demographics Similar to Immigrants from Honduras by Poverty
In terms of poverty, the demographic groups most similar to Immigrants from Honduras are Immigrants from Congo (16.1%, a difference of 0.23%), Immigrants from Dominica (16.1%, a difference of 0.43%), U.S. Virgin Islander (16.1%, a difference of 0.72%), Arapaho (16.3%, a difference of 0.74%), and Menominee (16.4%, a difference of 1.7%).
| Demographics | Rating | Rank | Poverty |
| Immigrants | Grenada | 0.0 /100 | #313 | Tragic 15.8% |
| Immigrants | Somalia | 0.0 /100 | #314 | Tragic 15.8% |
| British West Indians | 0.0 /100 | #315 | Tragic 15.9% |
| Hondurans | 0.0 /100 | #316 | Tragic 15.9% |
| U.S. Virgin Islanders | 0.0 /100 | #317 | Tragic 16.1% |
| Immigrants | Dominica | 0.0 /100 | #318 | Tragic 16.1% |
| Immigrants | Congo | 0.0 /100 | #319 | Tragic 16.1% |
| Immigrants | Honduras | 0.0 /100 | #320 | Tragic 16.2% |
| Arapaho | 0.0 /100 | #321 | Tragic 16.3% |
| Menominee | 0.0 /100 | #322 | Tragic 16.4% |
| Colville | 0.0 /100 | #323 | Tragic 16.6% |
| Yakama | 0.0 /100 | #324 | Tragic 16.7% |
| Central American Indians | 0.0 /100 | #325 | Tragic 16.7% |
| Paiute | 0.0 /100 | #326 | Tragic 16.7% |
| Kiowa | 0.0 /100 | #327 | Tragic 16.8% |
Demographics Similar to South American Indians by Poverty
In terms of poverty, the demographic groups most similar to South American Indians are Delaware (12.7%, a difference of 0.25%), Arab (12.7%, a difference of 0.29%), Immigrants from Kuwait (12.7%, a difference of 0.33%), Iraqi (12.7%, a difference of 0.34%), and Immigrants from Lebanon (12.8%, a difference of 0.65%).
| Demographics | Rating | Rank | Poverty |
| Israelis | 36.4 /100 | #185 | Fair 12.5% |
| Immigrants | Sierra Leone | 36.3 /100 | #186 | Fair 12.5% |
| Hawaiians | 34.1 /100 | #187 | Fair 12.5% |
| Immigrants | Costa Rica | 33.3 /100 | #188 | Fair 12.5% |
| Aleuts | 33.2 /100 | #189 | Fair 12.5% |
| Immigrants | South America | 32.3 /100 | #190 | Fair 12.5% |
| Sierra Leoneans | 31.5 /100 | #191 | Fair 12.6% |
| South American Indians | 23.3 /100 | #192 | Fair 12.7% |
| Delaware | 21.4 /100 | #193 | Fair 12.7% |
| Arabs | 21.1 /100 | #194 | Fair 12.7% |
| Immigrants | Kuwait | 20.9 /100 | #195 | Fair 12.7% |
| Iraqis | 20.8 /100 | #196 | Fair 12.7% |
| Immigrants | Lebanon | 18.7 /100 | #197 | Poor 12.8% |
| Spanish | 18.7 /100 | #198 | Poor 12.8% |
| Immigrants | Kenya | 17.5 /100 | #199 | Poor 12.8% |