Immigrants from Guyana vs Immigrants from Netherlands Female Poverty Among 25-34 Year Olds
COMPARE
Immigrants from Guyana
Immigrants from Netherlands
Female Poverty Among 25-34 Year Olds
Female Poverty Among 25-34 Year Olds Comparison
Immigrants from Guyana
Immigrants from Netherlands
14.3%
FEMALE POVERTY AMONG 25-34 YEAR OLDS
6.6/ 100
METRIC RATING
212th/ 347
METRIC RANK
12.8%
FEMALE POVERTY AMONG 25-34 YEAR OLDS
92.0/ 100
METRIC RATING
124th/ 347
METRIC RANK
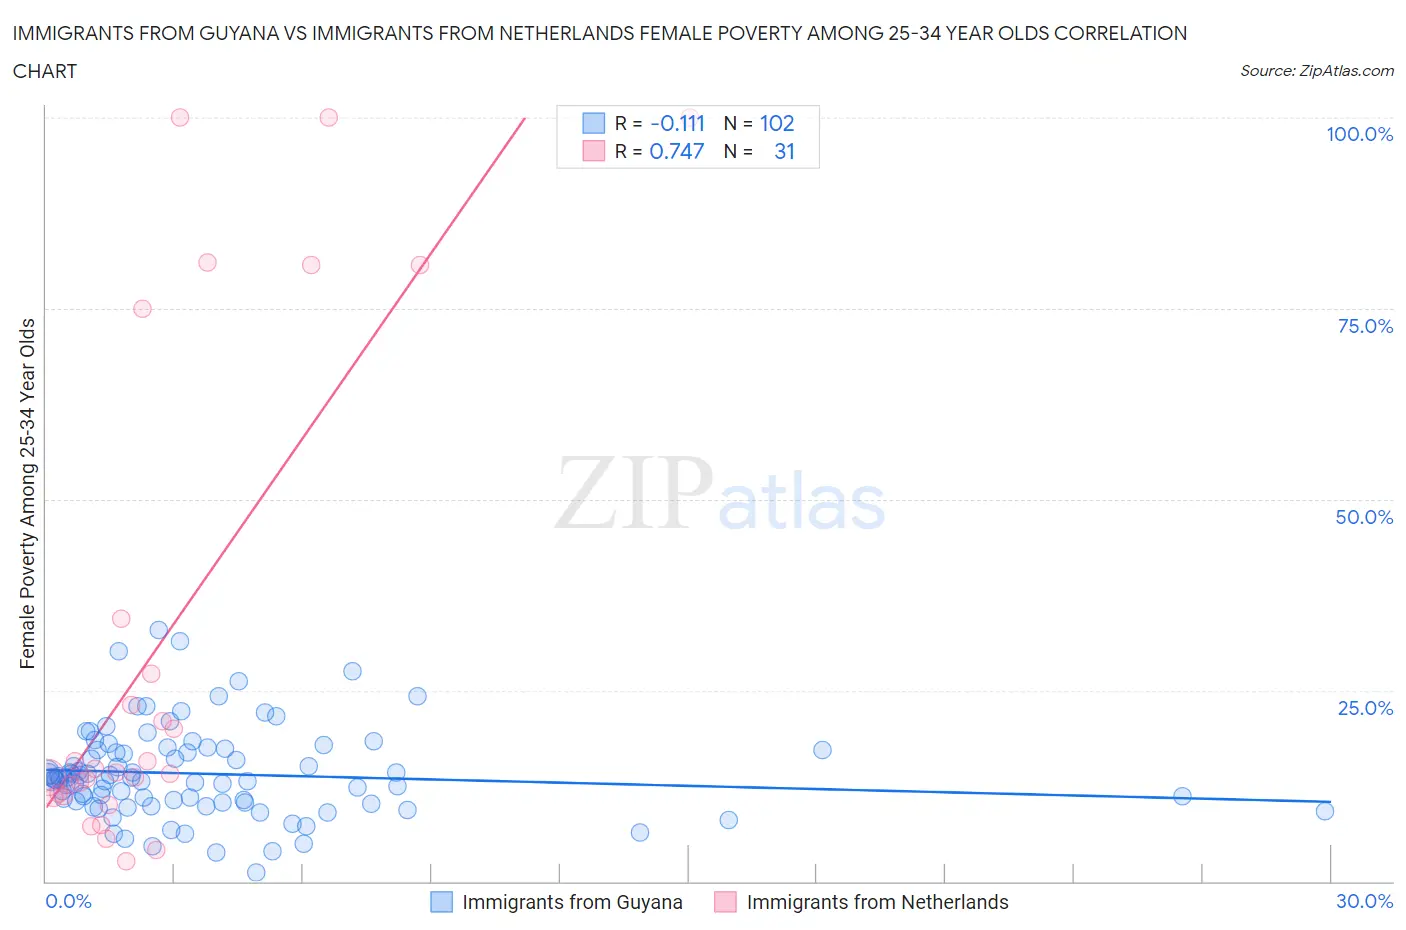
Immigrants from Guyana vs Immigrants from Netherlands Female Poverty Among 25-34 Year Olds Correlation Chart
The statistical analysis conducted on geographies consisting of 181,727,129 people shows a poor negative correlation between the proportion of Immigrants from Guyana and poverty level among females between the ages 25 and 34 in the United States with a correlation coefficient (R) of -0.111 and weighted average of 14.3%. Similarly, the statistical analysis conducted on geographies consisting of 234,780,200 people shows a strong positive correlation between the proportion of Immigrants from Netherlands and poverty level among females between the ages 25 and 34 in the United States with a correlation coefficient (R) of 0.747 and weighted average of 12.8%, a difference of 11.1%.
Female Poverty Among 25-34 Year Olds Correlation Summary
| Measurement | Immigrants from Guyana | Immigrants from Netherlands |
| Minimum | 1.1% | 2.7% |
| Maximum | 32.9% | 100.0% |
| Range | 31.7% | 97.3% |
| Mean | 14.1% | 30.8% |
| Median | 13.3% | 14.2% |
| Interquartile 25% (IQ1) | 10.3% | 11.1% |
| Interquartile 75% (IQ3) | 17.2% | 34.4% |
| Interquartile Range (IQR) | 6.9% | 23.3% |
| Standard Deviation (Sample) | 5.9% | 32.5% |
| Standard Deviation (Population) | 5.9% | 32.0% |
Similar Demographics by Female Poverty Among 25-34 Year Olds
Demographics Similar to Immigrants from Guyana by Female Poverty Among 25-34 Year Olds
In terms of female poverty among 25-34 year olds, the demographic groups most similar to Immigrants from Guyana are Puget Sound Salish (14.3%, a difference of 0.030%), French (14.3%, a difference of 0.13%), Immigrants from Nigeria (14.3%, a difference of 0.15%), French Canadian (14.3%, a difference of 0.40%), and Spanish American Indian (14.3%, a difference of 0.40%).
| Demographics | Rating | Rank | Female Poverty Among 25-34 Year Olds |
| Immigrants | Africa | 13.4 /100 | #205 | Poor 14.1% |
| Hungarians | 11.8 /100 | #206 | Poor 14.1% |
| Japanese | 11.7 /100 | #207 | Poor 14.1% |
| Immigrants | Panama | 11.6 /100 | #208 | Poor 14.1% |
| Guyanese | 8.6 /100 | #209 | Tragic 14.2% |
| Panamanians | 8.6 /100 | #210 | Tragic 14.2% |
| Trinidadians and Tobagonians | 8.2 /100 | #211 | Tragic 14.2% |
| Immigrants | Guyana | 6.6 /100 | #212 | Tragic 14.3% |
| Puget Sound Salish | 6.5 /100 | #213 | Tragic 14.3% |
| French | 6.2 /100 | #214 | Tragic 14.3% |
| Immigrants | Nigeria | 6.2 /100 | #215 | Tragic 14.3% |
| French Canadians | 5.5 /100 | #216 | Tragic 14.3% |
| Spanish American Indians | 5.5 /100 | #217 | Tragic 14.3% |
| Immigrants | Thailand | 5.2 /100 | #218 | Tragic 14.3% |
| Ecuadorians | 5.2 /100 | #219 | Tragic 14.3% |
Demographics Similar to Immigrants from Netherlands by Female Poverty Among 25-34 Year Olds
In terms of female poverty among 25-34 year olds, the demographic groups most similar to Immigrants from Netherlands are Immigrants from Canada (12.9%, a difference of 0.15%), Slovene (12.8%, a difference of 0.22%), Immigrants from Fiji (12.9%, a difference of 0.23%), Immigrants from Western Asia (12.8%, a difference of 0.24%), and Romanian (12.8%, a difference of 0.26%).
| Demographics | Rating | Rank | Female Poverty Among 25-34 Year Olds |
| Immigrants | Kuwait | 93.1 /100 | #117 | Exceptional 12.8% |
| Mongolians | 93.0 /100 | #118 | Exceptional 12.8% |
| Immigrants | Nepal | 93.0 /100 | #119 | Exceptional 12.8% |
| Carpatho Rusyns | 93.0 /100 | #120 | Exceptional 12.8% |
| Romanians | 92.8 /100 | #121 | Exceptional 12.8% |
| Immigrants | Western Asia | 92.7 /100 | #122 | Exceptional 12.8% |
| Slovenes | 92.7 /100 | #123 | Exceptional 12.8% |
| Immigrants | Netherlands | 92.0 /100 | #124 | Exceptional 12.8% |
| Immigrants | Canada | 91.5 /100 | #125 | Exceptional 12.9% |
| Immigrants | Fiji | 91.2 /100 | #126 | Exceptional 12.9% |
| Czechs | 90.3 /100 | #127 | Exceptional 12.9% |
| Syrians | 90.2 /100 | #128 | Exceptional 12.9% |
| Immigrants | North America | 89.7 /100 | #129 | Excellent 12.9% |
| Immigrants | Uzbekistan | 89.6 /100 | #130 | Excellent 12.9% |
| Pakistanis | 88.4 /100 | #131 | Excellent 13.0% |