Immigrants from Cabo Verde vs Immigrants from Netherlands Female Poverty Among 25-34 Year Olds
COMPARE
Immigrants from Cabo Verde
Immigrants from Netherlands
Female Poverty Among 25-34 Year Olds
Female Poverty Among 25-34 Year Olds Comparison
Immigrants from Cabo Verde
Immigrants from Netherlands
16.9%
FEMALE POVERTY AMONG 25-34 YEAR OLDS
0.0/ 100
METRIC RATING
305th/ 347
METRIC RANK
12.8%
FEMALE POVERTY AMONG 25-34 YEAR OLDS
92.0/ 100
METRIC RATING
124th/ 347
METRIC RANK
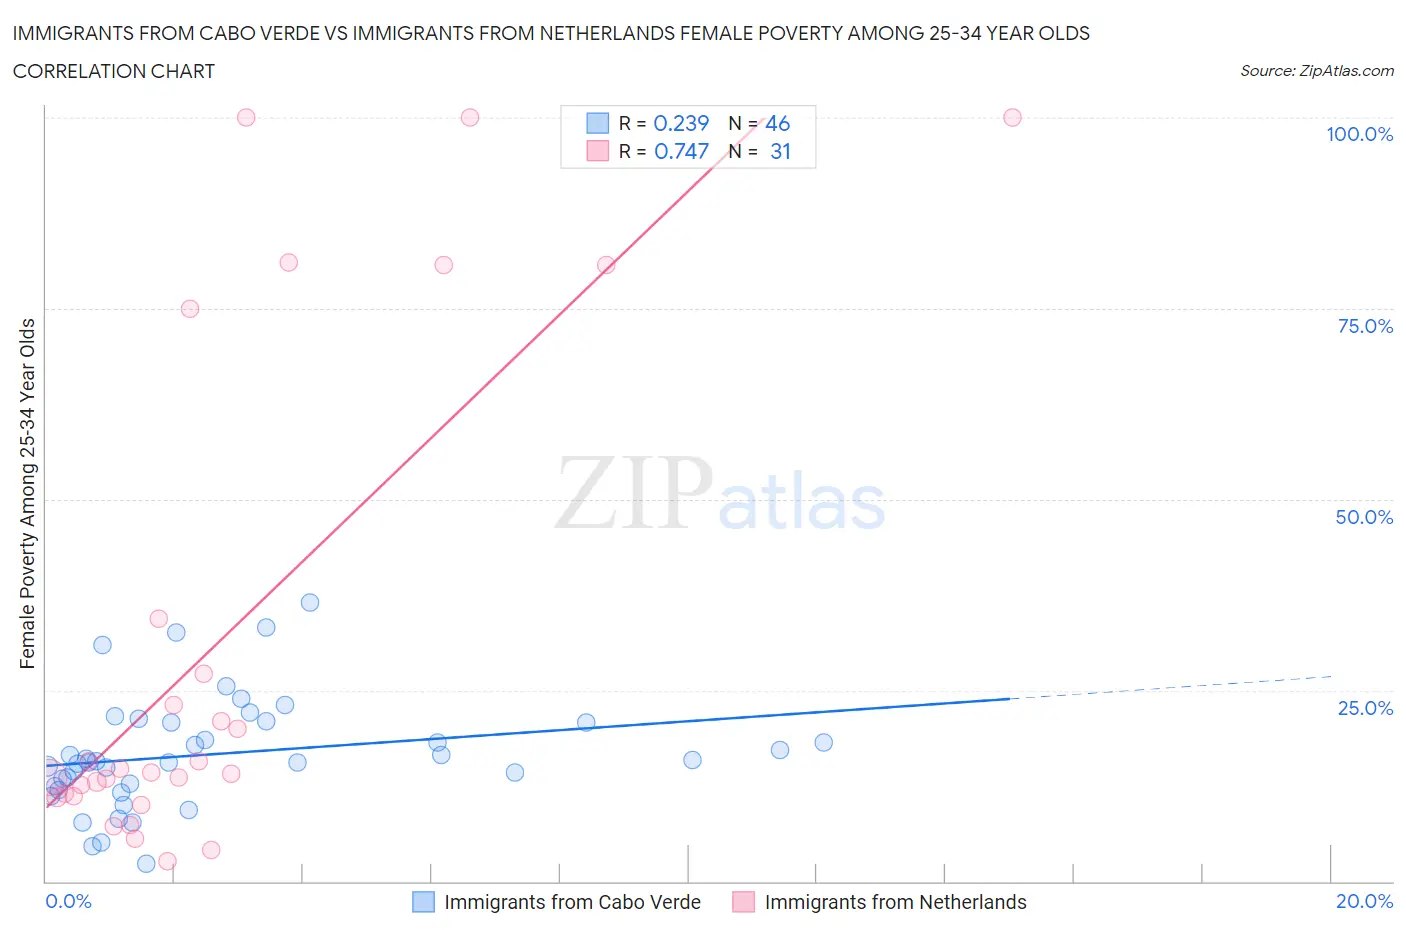
Immigrants from Cabo Verde vs Immigrants from Netherlands Female Poverty Among 25-34 Year Olds Correlation Chart
The statistical analysis conducted on geographies consisting of 37,988,788 people shows a weak positive correlation between the proportion of Immigrants from Cabo Verde and poverty level among females between the ages 25 and 34 in the United States with a correlation coefficient (R) of 0.239 and weighted average of 16.9%. Similarly, the statistical analysis conducted on geographies consisting of 234,780,200 people shows a strong positive correlation between the proportion of Immigrants from Netherlands and poverty level among females between the ages 25 and 34 in the United States with a correlation coefficient (R) of 0.747 and weighted average of 12.8%, a difference of 31.7%.
Female Poverty Among 25-34 Year Olds Correlation Summary
| Measurement | Immigrants from Cabo Verde | Immigrants from Netherlands |
| Minimum | 2.3% | 2.7% |
| Maximum | 36.4% | 100.0% |
| Range | 34.2% | 97.3% |
| Mean | 16.7% | 30.8% |
| Median | 15.6% | 14.2% |
| Interquartile 25% (IQ1) | 12.5% | 11.1% |
| Interquartile 75% (IQ3) | 20.8% | 34.4% |
| Interquartile Range (IQR) | 8.3% | 23.3% |
| Standard Deviation (Sample) | 7.3% | 32.5% |
| Standard Deviation (Population) | 7.2% | 32.0% |
Similar Demographics by Female Poverty Among 25-34 Year Olds
Demographics Similar to Immigrants from Cabo Verde by Female Poverty Among 25-34 Year Olds
In terms of female poverty among 25-34 year olds, the demographic groups most similar to Immigrants from Cabo Verde are Honduran (16.9%, a difference of 0.17%), Immigrants from Mexico (16.8%, a difference of 0.58%), Chickasaw (17.0%, a difference of 0.58%), Yaqui (17.0%, a difference of 0.60%), and African (17.0%, a difference of 0.80%).
| Demographics | Rating | Rank | Female Poverty Among 25-34 Year Olds |
| Blackfeet | 0.0 /100 | #298 | Tragic 16.7% |
| Spanish Americans | 0.0 /100 | #299 | Tragic 16.7% |
| U.S. Virgin Islanders | 0.0 /100 | #300 | Tragic 16.7% |
| Immigrants | Congo | 0.0 /100 | #301 | Tragic 16.7% |
| Alaska Natives | 0.0 /100 | #302 | Tragic 16.8% |
| Immigrants | Mexico | 0.0 /100 | #303 | Tragic 16.8% |
| Hondurans | 0.0 /100 | #304 | Tragic 16.9% |
| Immigrants | Cabo Verde | 0.0 /100 | #305 | Tragic 16.9% |
| Chickasaw | 0.0 /100 | #306 | Tragic 17.0% |
| Yaqui | 0.0 /100 | #307 | Tragic 17.0% |
| Africans | 0.0 /100 | #308 | Tragic 17.0% |
| Ottawa | 0.0 /100 | #309 | Tragic 17.1% |
| Cherokee | 0.0 /100 | #310 | Tragic 17.2% |
| Immigrants | Honduras | 0.0 /100 | #311 | Tragic 17.3% |
| Iroquois | 0.0 /100 | #312 | Tragic 17.5% |
Demographics Similar to Immigrants from Netherlands by Female Poverty Among 25-34 Year Olds
In terms of female poverty among 25-34 year olds, the demographic groups most similar to Immigrants from Netherlands are Immigrants from Canada (12.9%, a difference of 0.15%), Slovene (12.8%, a difference of 0.22%), Immigrants from Fiji (12.9%, a difference of 0.23%), Immigrants from Western Asia (12.8%, a difference of 0.24%), and Romanian (12.8%, a difference of 0.26%).
| Demographics | Rating | Rank | Female Poverty Among 25-34 Year Olds |
| Immigrants | Kuwait | 93.1 /100 | #117 | Exceptional 12.8% |
| Mongolians | 93.0 /100 | #118 | Exceptional 12.8% |
| Immigrants | Nepal | 93.0 /100 | #119 | Exceptional 12.8% |
| Carpatho Rusyns | 93.0 /100 | #120 | Exceptional 12.8% |
| Romanians | 92.8 /100 | #121 | Exceptional 12.8% |
| Immigrants | Western Asia | 92.7 /100 | #122 | Exceptional 12.8% |
| Slovenes | 92.7 /100 | #123 | Exceptional 12.8% |
| Immigrants | Netherlands | 92.0 /100 | #124 | Exceptional 12.8% |
| Immigrants | Canada | 91.5 /100 | #125 | Exceptional 12.9% |
| Immigrants | Fiji | 91.2 /100 | #126 | Exceptional 12.9% |
| Czechs | 90.3 /100 | #127 | Exceptional 12.9% |
| Syrians | 90.2 /100 | #128 | Exceptional 12.9% |
| Immigrants | North America | 89.7 /100 | #129 | Excellent 12.9% |
| Immigrants | Uzbekistan | 89.6 /100 | #130 | Excellent 12.9% |
| Pakistanis | 88.4 /100 | #131 | Excellent 13.0% |