Immigrants from Greece vs Bermudan Single Father Poverty
COMPARE
Immigrants from Greece
Bermudan
Single Father Poverty
Single Father Poverty Comparison
Immigrants from Greece
Bermudans
16.7%
SINGLE FATHER POVERTY
8.1/ 100
METRIC RATING
221st/ 347
METRIC RANK
16.9%
SINGLE FATHER POVERTY
2.6/ 100
METRIC RATING
239th/ 347
METRIC RANK
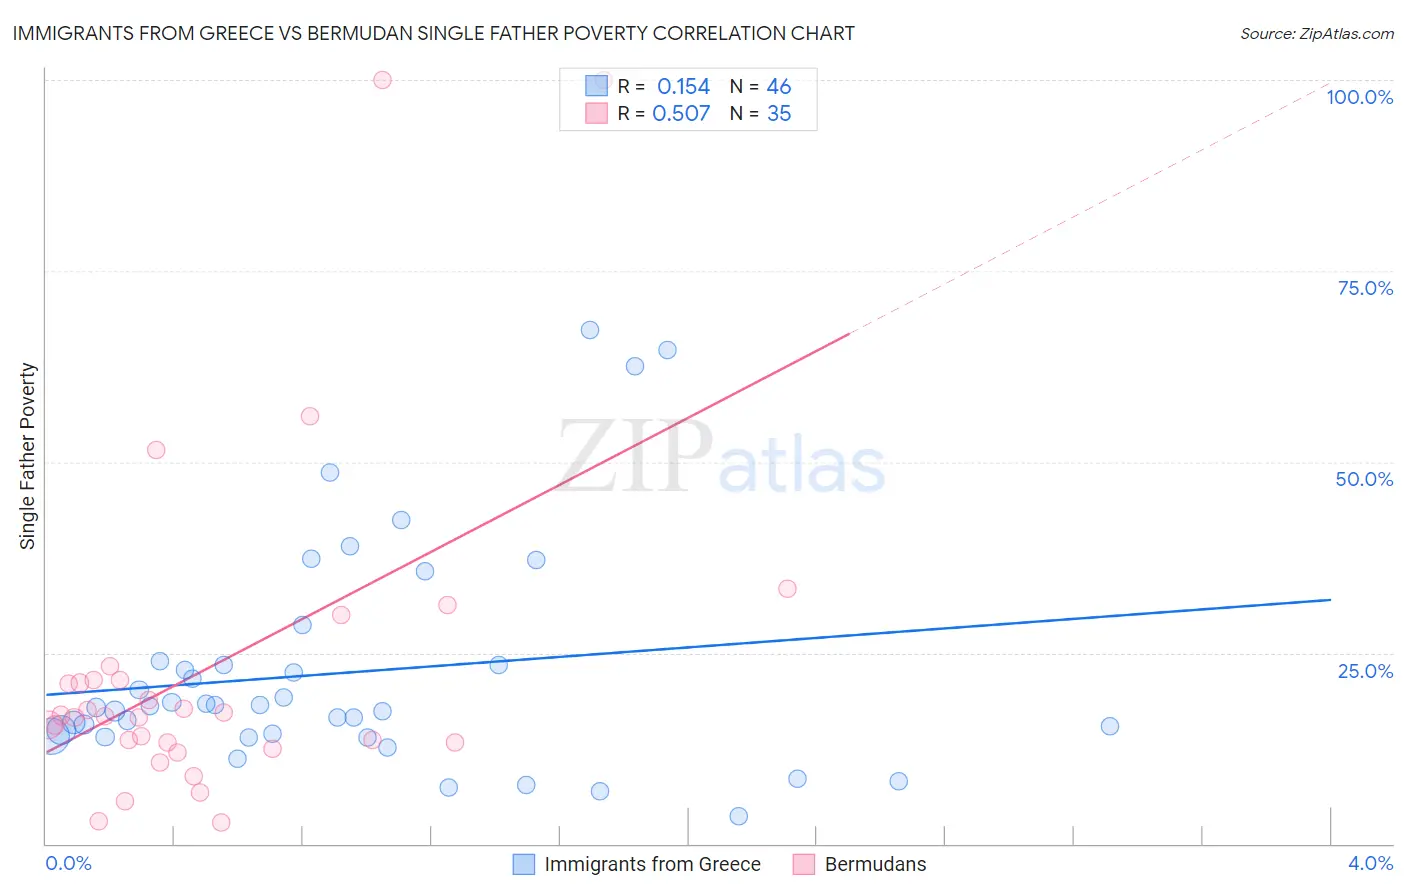
Immigrants from Greece vs Bermudan Single Father Poverty Correlation Chart
The statistical analysis conducted on geographies consisting of 176,789,916 people shows a poor positive correlation between the proportion of Immigrants from Greece and poverty level among single fathers in the United States with a correlation coefficient (R) of 0.154 and weighted average of 16.7%. Similarly, the statistical analysis conducted on geographies consisting of 52,766,587 people shows a substantial positive correlation between the proportion of Bermudans and poverty level among single fathers in the United States with a correlation coefficient (R) of 0.507 and weighted average of 16.9%, a difference of 1.3%.
Single Father Poverty Correlation Summary
| Measurement | Immigrants from Greece | Bermudan |
| Minimum | 3.6% | 2.7% |
| Maximum | 67.2% | 100.0% |
| Range | 63.7% | 97.3% |
| Mean | 22.4% | 23.1% |
| Median | 18.0% | 16.7% |
| Interquartile 25% (IQ1) | 14.1% | 13.2% |
| Interquartile 75% (IQ3) | 23.4% | 21.5% |
| Interquartile Range (IQR) | 9.4% | 8.2% |
| Standard Deviation (Sample) | 14.8% | 22.2% |
| Standard Deviation (Population) | 14.7% | 21.9% |
Demographics Similar to Immigrants from Greece and Bermudans by Single Father Poverty
In terms of single father poverty, the demographic groups most similar to Immigrants from Greece are Immigrants from Denmark (16.7%, a difference of 0.0%), Immigrants from Spain (16.7%, a difference of 0.010%), Immigrants from Austria (16.8%, a difference of 0.17%), Immigrants from Norway (16.8%, a difference of 0.25%), and Menominee (16.8%, a difference of 0.27%). Similarly, the demographic groups most similar to Bermudans are Finnish (16.9%, a difference of 0.010%), Immigrants from Saudi Arabia (16.9%, a difference of 0.020%), Immigrants from Western Europe (16.9%, a difference of 0.090%), Immigrants from Germany (16.9%, a difference of 0.090%), and Subsaharan African (16.9%, a difference of 0.090%).
| Demographics | Rating | Rank | Single Father Poverty |
| Immigrants | Denmark | 8.1 /100 | #220 | Tragic 16.7% |
| Immigrants | Greece | 8.1 /100 | #221 | Tragic 16.7% |
| Immigrants | Spain | 8.0 /100 | #222 | Tragic 16.7% |
| Immigrants | Austria | 7.0 /100 | #223 | Tragic 16.8% |
| Immigrants | Norway | 6.5 /100 | #224 | Tragic 16.8% |
| Menominee | 6.4 /100 | #225 | Tragic 16.8% |
| Hispanics or Latinos | 6.1 /100 | #226 | Tragic 16.8% |
| British | 5.6 /100 | #227 | Tragic 16.8% |
| Belgians | 5.3 /100 | #228 | Tragic 16.8% |
| Israelis | 4.6 /100 | #229 | Tragic 16.8% |
| Immigrants | Trinidad and Tobago | 4.5 /100 | #230 | Tragic 16.8% |
| Spanish Americans | 3.7 /100 | #231 | Tragic 16.9% |
| Immigrants | Grenada | 3.7 /100 | #232 | Tragic 16.9% |
| Senegalese | 3.2 /100 | #233 | Tragic 16.9% |
| Marshallese | 3.1 /100 | #234 | Tragic 16.9% |
| Immigrants | Western Europe | 2.9 /100 | #235 | Tragic 16.9% |
| Immigrants | Germany | 2.9 /100 | #236 | Tragic 16.9% |
| Sub-Saharan Africans | 2.9 /100 | #237 | Tragic 16.9% |
| Immigrants | Saudi Arabia | 2.7 /100 | #238 | Tragic 16.9% |
| Bermudans | 2.6 /100 | #239 | Tragic 16.9% |
| Finns | 2.6 /100 | #240 | Tragic 16.9% |