Cape Verdean vs Bermudan Single Father Poverty
COMPARE
Cape Verdean
Bermudan
Single Father Poverty
Single Father Poverty Comparison
Cape Verdeans
Bermudans
16.5%
SINGLE FATHER POVERTY
24.4/ 100
METRIC RATING
194th/ 347
METRIC RANK
16.9%
SINGLE FATHER POVERTY
2.6/ 100
METRIC RATING
239th/ 347
METRIC RANK
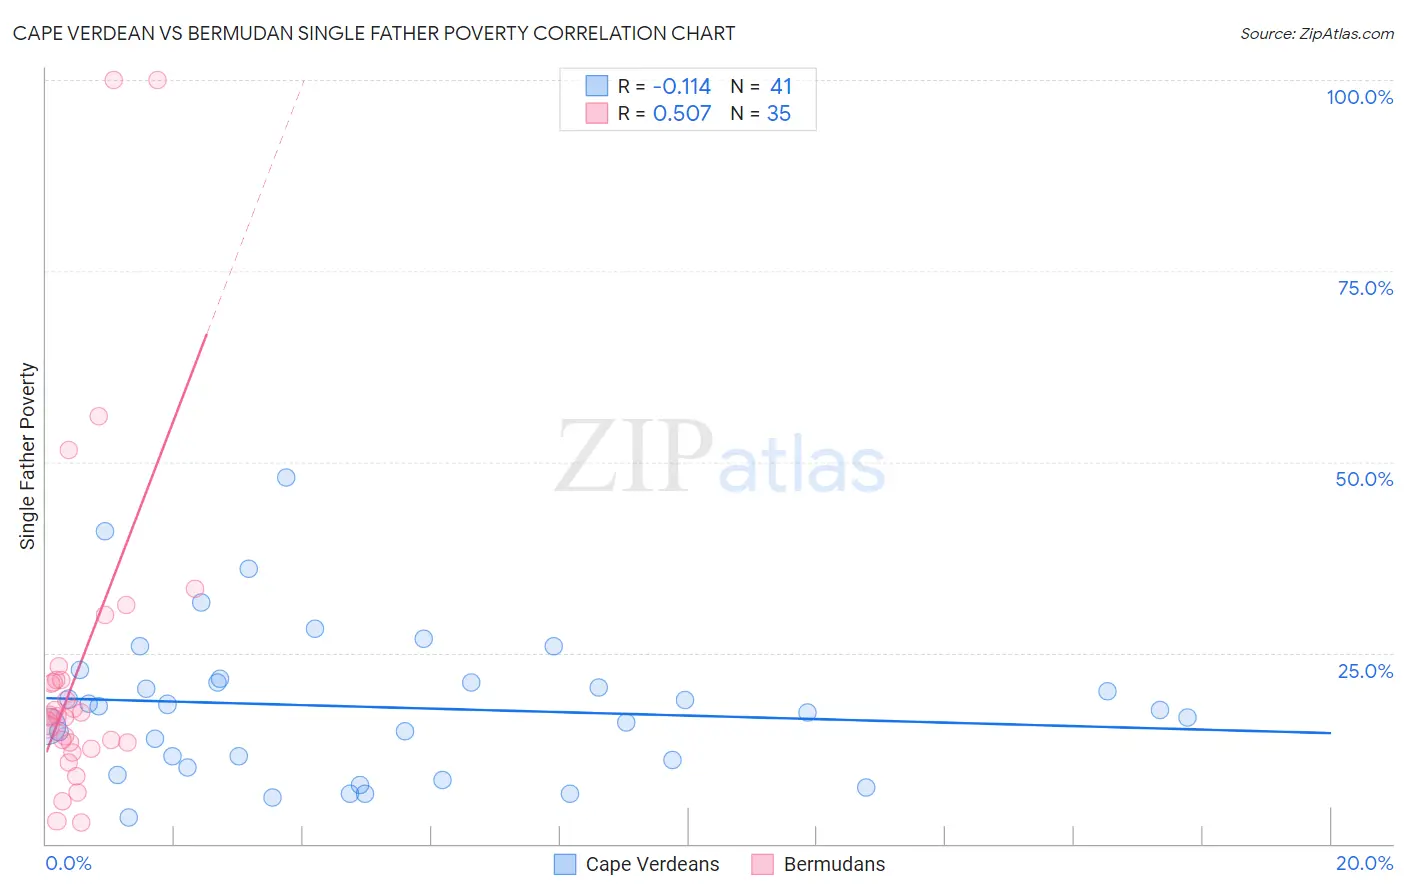
Cape Verdean vs Bermudan Single Father Poverty Correlation Chart
The statistical analysis conducted on geographies consisting of 96,813,617 people shows a poor negative correlation between the proportion of Cape Verdeans and poverty level among single fathers in the United States with a correlation coefficient (R) of -0.114 and weighted average of 16.5%. Similarly, the statistical analysis conducted on geographies consisting of 52,766,587 people shows a substantial positive correlation between the proportion of Bermudans and poverty level among single fathers in the United States with a correlation coefficient (R) of 0.507 and weighted average of 16.9%, a difference of 2.7%.
Single Father Poverty Correlation Summary
| Measurement | Cape Verdean | Bermudan |
| Minimum | 3.5% | 2.7% |
| Maximum | 47.9% | 100.0% |
| Range | 44.4% | 97.3% |
| Mean | 17.9% | 23.1% |
| Median | 17.4% | 16.7% |
| Interquartile 25% (IQ1) | 10.4% | 13.2% |
| Interquartile 75% (IQ3) | 21.3% | 21.5% |
| Interquartile Range (IQR) | 10.9% | 8.2% |
| Standard Deviation (Sample) | 9.6% | 22.2% |
| Standard Deviation (Population) | 9.5% | 21.9% |
Similar Demographics by Single Father Poverty
Demographics Similar to Cape Verdeans by Single Father Poverty
In terms of single father poverty, the demographic groups most similar to Cape Verdeans are Immigrants from Barbados (16.5%, a difference of 0.0%), Ecuadorian (16.5%, a difference of 0.010%), Immigrants from Switzerland (16.5%, a difference of 0.020%), Immigrants from Canada (16.5%, a difference of 0.15%), and Immigrants from Guyana (16.5%, a difference of 0.16%).
| Demographics | Rating | Rank | Single Father Poverty |
| Ukrainians | 30.4 /100 | #187 | Fair 16.4% |
| Russians | 30.1 /100 | #188 | Fair 16.4% |
| Latvians | 28.9 /100 | #189 | Fair 16.5% |
| Immigrants | Burma/Myanmar | 28.0 /100 | #190 | Fair 16.5% |
| Immigrants | Guyana | 27.1 /100 | #191 | Fair 16.5% |
| Immigrants | Switzerland | 24.8 /100 | #192 | Fair 16.5% |
| Ecuadorians | 24.5 /100 | #193 | Fair 16.5% |
| Cape Verdeans | 24.4 /100 | #194 | Fair 16.5% |
| Immigrants | Barbados | 24.3 /100 | #195 | Fair 16.5% |
| Immigrants | Canada | 21.9 /100 | #196 | Fair 16.5% |
| Immigrants | Northern Europe | 20.3 /100 | #197 | Fair 16.5% |
| Romanians | 20.1 /100 | #198 | Fair 16.5% |
| Immigrants | Belize | 19.8 /100 | #199 | Poor 16.5% |
| Syrians | 17.4 /100 | #200 | Poor 16.6% |
| Cubans | 16.5 /100 | #201 | Poor 16.6% |
Demographics Similar to Bermudans by Single Father Poverty
In terms of single father poverty, the demographic groups most similar to Bermudans are Finnish (16.9%, a difference of 0.010%), Immigrants from Saudi Arabia (16.9%, a difference of 0.020%), Immigrants from Western Europe (16.9%, a difference of 0.090%), Immigrants from Germany (16.9%, a difference of 0.090%), and Subsaharan African (16.9%, a difference of 0.090%).
| Demographics | Rating | Rank | Single Father Poverty |
| Immigrants | Grenada | 3.7 /100 | #232 | Tragic 16.9% |
| Senegalese | 3.2 /100 | #233 | Tragic 16.9% |
| Marshallese | 3.1 /100 | #234 | Tragic 16.9% |
| Immigrants | Western Europe | 2.9 /100 | #235 | Tragic 16.9% |
| Immigrants | Germany | 2.9 /100 | #236 | Tragic 16.9% |
| Sub-Saharan Africans | 2.9 /100 | #237 | Tragic 16.9% |
| Immigrants | Saudi Arabia | 2.7 /100 | #238 | Tragic 16.9% |
| Bermudans | 2.6 /100 | #239 | Tragic 16.9% |
| Finns | 2.6 /100 | #240 | Tragic 16.9% |
| Czechs | 2.3 /100 | #241 | Tragic 17.0% |
| Moroccans | 2.1 /100 | #242 | Tragic 17.0% |
| Immigrants | Cabo Verde | 1.6 /100 | #243 | Tragic 17.0% |
| Hondurans | 1.6 /100 | #244 | Tragic 17.0% |
| Trinidadians and Tobagonians | 1.5 /100 | #245 | Tragic 17.0% |
| Immigrants | Ireland | 1.4 /100 | #246 | Tragic 17.1% |