Immigrants from Greece vs Afghan Child Poverty Under the Age of 16
COMPARE
Immigrants from Greece
Afghan
Child Poverty Under the Age of 16
Child Poverty Under the Age of 16 Comparison
Immigrants from Greece
Afghans
13.9%
CHILD POVERTY UNDER THE AGE OF 16
99.1/ 100
METRIC RATING
51st/ 347
METRIC RANK
16.2%
CHILD POVERTY UNDER THE AGE OF 16
52.3/ 100
METRIC RATING
172nd/ 347
METRIC RANK
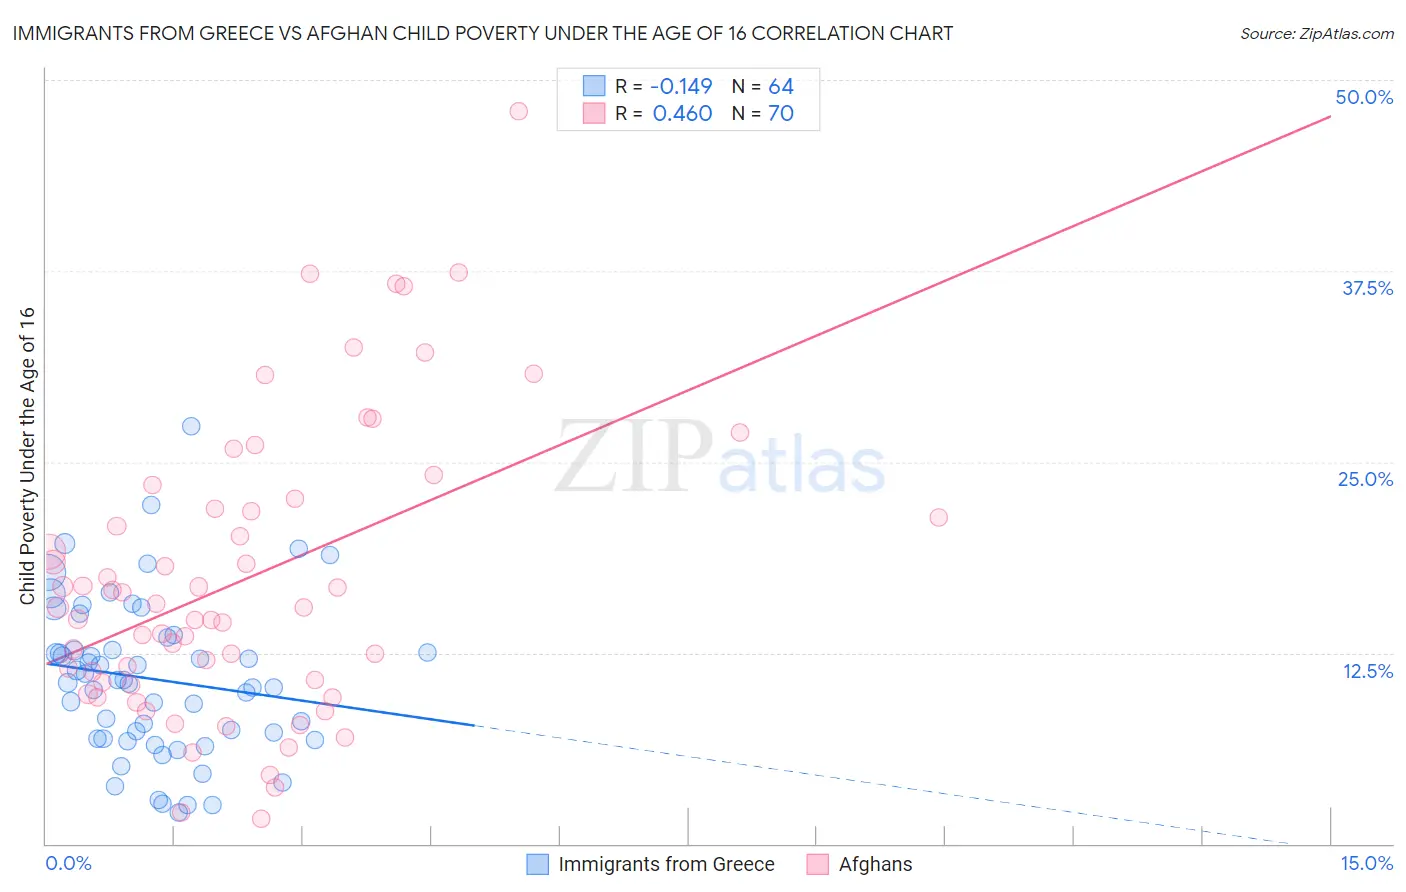
Immigrants from Greece vs Afghan Child Poverty Under the Age of 16 Correlation Chart
The statistical analysis conducted on geographies consisting of 215,141,811 people shows a poor negative correlation between the proportion of Immigrants from Greece and poverty level among children under the age of 16 in the United States with a correlation coefficient (R) of -0.149 and weighted average of 13.9%. Similarly, the statistical analysis conducted on geographies consisting of 148,458,786 people shows a moderate positive correlation between the proportion of Afghans and poverty level among children under the age of 16 in the United States with a correlation coefficient (R) of 0.460 and weighted average of 16.2%, a difference of 16.0%.
Child Poverty Under the Age of 16 Correlation Summary
| Measurement | Immigrants from Greece | Afghan |
| Minimum | 2.0% | 1.6% |
| Maximum | 27.3% | 48.0% |
| Range | 25.3% | 46.4% |
| Mean | 10.8% | 17.3% |
| Median | 10.6% | 15.5% |
| Interquartile 25% (IQ1) | 6.9% | 10.6% |
| Interquartile 75% (IQ3) | 13.1% | 21.9% |
| Interquartile Range (IQR) | 6.2% | 11.3% |
| Standard Deviation (Sample) | 5.1% | 9.5% |
| Standard Deviation (Population) | 5.1% | 9.4% |
Similar Demographics by Child Poverty Under the Age of 16
Demographics Similar to Immigrants from Greece by Child Poverty Under the Age of 16
In terms of child poverty under the age of 16, the demographic groups most similar to Immigrants from Greece are Immigrants from Czechoslovakia (13.9%, a difference of 0.12%), Italian (13.9%, a difference of 0.35%), Korean (13.9%, a difference of 0.38%), Estonian (13.9%, a difference of 0.44%), and Immigrants from Asia (13.8%, a difference of 0.60%).
| Demographics | Rating | Rank | Child Poverty Under the Age of 16 |
| Greeks | 99.3 /100 | #44 | Exceptional 13.8% |
| Czechs | 99.3 /100 | #45 | Exceptional 13.8% |
| Immigrants | Asia | 99.2 /100 | #46 | Exceptional 13.8% |
| Estonians | 99.2 /100 | #47 | Exceptional 13.9% |
| Koreans | 99.2 /100 | #48 | Exceptional 13.9% |
| Italians | 99.2 /100 | #49 | Exceptional 13.9% |
| Immigrants | Czechoslovakia | 99.1 /100 | #50 | Exceptional 13.9% |
| Immigrants | Greece | 99.1 /100 | #51 | Exceptional 13.9% |
| Poles | 98.9 /100 | #52 | Exceptional 14.0% |
| Immigrants | Israel | 98.8 /100 | #53 | Exceptional 14.1% |
| Tsimshian | 98.8 /100 | #54 | Exceptional 14.1% |
| Immigrants | Indonesia | 98.7 /100 | #55 | Exceptional 14.1% |
| Immigrants | Serbia | 98.7 /100 | #56 | Exceptional 14.1% |
| Immigrants | Belgium | 98.6 /100 | #57 | Exceptional 14.1% |
| Immigrants | Pakistan | 98.6 /100 | #58 | Exceptional 14.1% |
Demographics Similar to Afghans by Child Poverty Under the Age of 16
In terms of child poverty under the age of 16, the demographic groups most similar to Afghans are Hungarian (16.2%, a difference of 0.020%), Immigrants from Saudi Arabia (16.2%, a difference of 0.020%), Immigrants from Colombia (16.1%, a difference of 0.26%), White/Caucasian (16.2%, a difference of 0.27%), and Uruguayan (16.1%, a difference of 0.29%).
| Demographics | Rating | Rank | Child Poverty Under the Age of 16 |
| Guamanians/Chamorros | 66.4 /100 | #165 | Good 15.9% |
| Immigrants | Oceania | 65.4 /100 | #166 | Good 15.9% |
| Costa Ricans | 61.1 /100 | #167 | Good 16.0% |
| South Americans | 57.9 /100 | #168 | Average 16.0% |
| Uruguayans | 54.7 /100 | #169 | Average 16.1% |
| Immigrants | Colombia | 54.4 /100 | #170 | Average 16.1% |
| Hungarians | 52.5 /100 | #171 | Average 16.2% |
| Afghans | 52.3 /100 | #172 | Average 16.2% |
| Immigrants | Saudi Arabia | 52.1 /100 | #173 | Average 16.2% |
| Whites/Caucasians | 50.0 /100 | #174 | Average 16.2% |
| Scotch-Irish | 47.1 /100 | #175 | Average 16.3% |
| Lebanese | 45.9 /100 | #176 | Average 16.3% |
| Ethiopians | 43.4 /100 | #177 | Average 16.3% |
| Immigrants | Ethiopia | 42.3 /100 | #178 | Average 16.4% |
| Immigrants | Syria | 42.3 /100 | #179 | Average 16.4% |