Immigrants from Fiji vs Central American Female Poverty Among 18-24 Year Olds
COMPARE
Immigrants from Fiji
Central American
Female Poverty Among 18-24 Year Olds
Female Poverty Among 18-24 Year Olds Comparison
Immigrants from Fiji
Central Americans
17.7%
FEMALE POVERTY AMONG 18-24 YEAR OLDS
100.0/ 100
METRIC RATING
26th/ 347
METRIC RANK
19.9%
FEMALE POVERTY AMONG 18-24 YEAR OLDS
70.0/ 100
METRIC RATING
164th/ 347
METRIC RANK
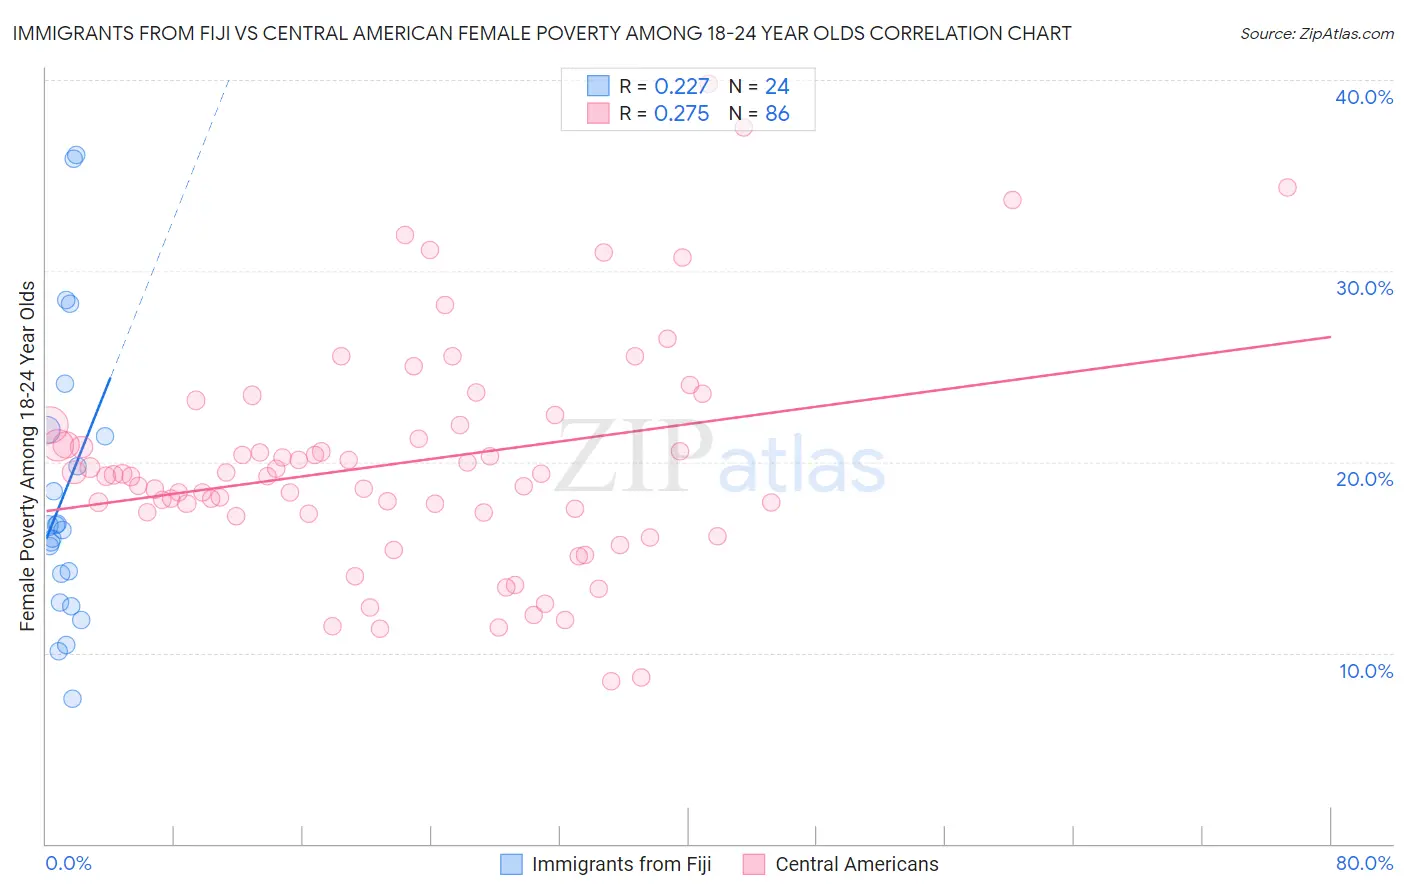
Immigrants from Fiji vs Central American Female Poverty Among 18-24 Year Olds Correlation Chart
The statistical analysis conducted on geographies consisting of 93,267,707 people shows a weak positive correlation between the proportion of Immigrants from Fiji and poverty level among females between the ages 18 and 24 in the United States with a correlation coefficient (R) of 0.227 and weighted average of 17.7%. Similarly, the statistical analysis conducted on geographies consisting of 487,103,061 people shows a weak positive correlation between the proportion of Central Americans and poverty level among females between the ages 18 and 24 in the United States with a correlation coefficient (R) of 0.275 and weighted average of 19.9%, a difference of 12.7%.
Female Poverty Among 18-24 Year Olds Correlation Summary
| Measurement | Immigrants from Fiji | Central American |
| Minimum | 7.6% | 8.5% |
| Maximum | 36.1% | 39.8% |
| Range | 28.5% | 31.3% |
| Mean | 18.4% | 20.0% |
| Median | 16.5% | 19.3% |
| Interquartile 25% (IQ1) | 13.4% | 17.3% |
| Interquartile 75% (IQ3) | 21.5% | 21.9% |
| Interquartile Range (IQR) | 8.1% | 4.6% |
| Standard Deviation (Sample) | 7.5% | 5.9% |
| Standard Deviation (Population) | 7.4% | 5.9% |
Similar Demographics by Female Poverty Among 18-24 Year Olds
Demographics Similar to Immigrants from Fiji by Female Poverty Among 18-24 Year Olds
In terms of female poverty among 18-24 year olds, the demographic groups most similar to Immigrants from Fiji are Colombian (17.7%, a difference of 0.11%), Venezuelan (17.7%, a difference of 0.24%), Immigrants from South Central Asia (17.6%, a difference of 0.33%), Maltese (17.6%, a difference of 0.51%), and Immigrants from North Macedonia (17.6%, a difference of 0.57%).
| Demographics | Rating | Rank | Female Poverty Among 18-24 Year Olds |
| Immigrants | Lithuania | 100.0 /100 | #19 | Exceptional 17.4% |
| Immigrants | Venezuela | 100.0 /100 | #20 | Exceptional 17.4% |
| Bolivians | 100.0 /100 | #21 | Exceptional 17.4% |
| Immigrants | Hong Kong | 100.0 /100 | #22 | Exceptional 17.5% |
| Immigrants | North Macedonia | 100.0 /100 | #23 | Exceptional 17.6% |
| Maltese | 100.0 /100 | #24 | Exceptional 17.6% |
| Immigrants | South Central Asia | 100.0 /100 | #25 | Exceptional 17.6% |
| Immigrants | Fiji | 100.0 /100 | #26 | Exceptional 17.7% |
| Colombians | 100.0 /100 | #27 | Exceptional 17.7% |
| Venezuelans | 100.0 /100 | #28 | Exceptional 17.7% |
| Portuguese | 100.0 /100 | #29 | Exceptional 17.8% |
| Immigrants | South Eastern Asia | 100.0 /100 | #30 | Exceptional 17.8% |
| Immigrants | Vietnam | 100.0 /100 | #31 | Exceptional 17.8% |
| Immigrants | Moldova | 100.0 /100 | #32 | Exceptional 17.9% |
| Native Hawaiians | 100.0 /100 | #33 | Exceptional 17.9% |
Demographics Similar to Central Americans by Female Poverty Among 18-24 Year Olds
In terms of female poverty among 18-24 year olds, the demographic groups most similar to Central Americans are Eastern European (19.9%, a difference of 0.040%), Belgian (19.9%, a difference of 0.050%), Malaysian (19.9%, a difference of 0.16%), French Canadian (19.9%, a difference of 0.19%), and Immigrants from Belize (19.8%, a difference of 0.25%).
| Demographics | Rating | Rank | Female Poverty Among 18-24 Year Olds |
| Danes | 75.5 /100 | #157 | Good 19.8% |
| Immigrants | Lebanon | 75.3 /100 | #158 | Good 19.8% |
| Trinidadians and Tobagonians | 74.4 /100 | #159 | Good 19.8% |
| Pakistanis | 74.1 /100 | #160 | Good 19.8% |
| Immigrants | Belize | 74.1 /100 | #161 | Good 19.8% |
| French Canadians | 73.0 /100 | #162 | Good 19.9% |
| Malaysians | 72.7 /100 | #163 | Good 19.9% |
| Central Americans | 70.0 /100 | #164 | Good 19.9% |
| Eastern Europeans | 69.3 /100 | #165 | Good 19.9% |
| Belgians | 69.1 /100 | #166 | Good 19.9% |
| Czechoslovakians | 61.8 /100 | #167 | Good 20.0% |
| Fijians | 59.1 /100 | #168 | Average 20.0% |
| Hmong | 55.4 /100 | #169 | Average 20.0% |
| Iranians | 54.7 /100 | #170 | Average 20.1% |
| Immigrants | Nigeria | 54.3 /100 | #171 | Average 20.1% |