Immigrants from England vs Samoan Single Father Poverty
COMPARE
Immigrants from England
Samoan
Single Father Poverty
Single Father Poverty Comparison
Immigrants from England
Samoans
16.7%
SINGLE FATHER POVERTY
9.5/ 100
METRIC RATING
216th/ 347
METRIC RANK
13.8%
SINGLE FATHER POVERTY
100.0/ 100
METRIC RATING
8th/ 347
METRIC RANK
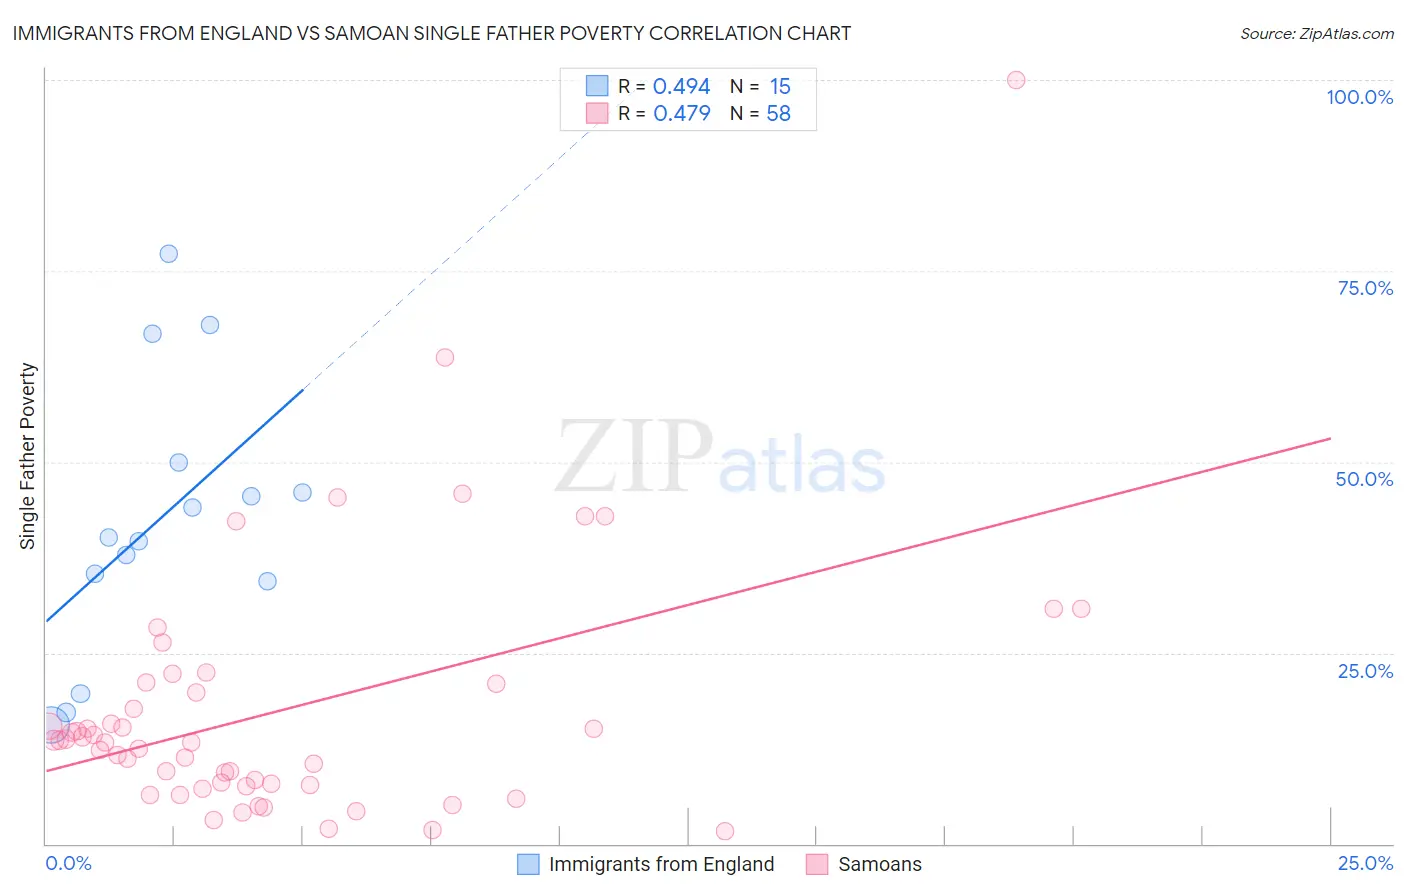
Immigrants from England vs Samoan Single Father Poverty Correlation Chart
The statistical analysis conducted on geographies consisting of 303,741,945 people shows a moderate positive correlation between the proportion of Immigrants from England and poverty level among single fathers in the United States with a correlation coefficient (R) of 0.494 and weighted average of 16.7%. Similarly, the statistical analysis conducted on geographies consisting of 195,405,703 people shows a moderate positive correlation between the proportion of Samoans and poverty level among single fathers in the United States with a correlation coefficient (R) of 0.479 and weighted average of 13.8%, a difference of 21.0%.
Single Father Poverty Correlation Summary
| Measurement | Immigrants from England | Samoan |
| Minimum | 15.5% | 1.7% |
| Maximum | 77.3% | 100.0% |
| Range | 61.8% | 98.3% |
| Mean | 42.5% | 17.6% |
| Median | 40.2% | 13.4% |
| Interquartile 25% (IQ1) | 34.4% | 7.7% |
| Interquartile 75% (IQ3) | 49.9% | 20.9% |
| Interquartile Range (IQR) | 15.5% | 13.2% |
| Standard Deviation (Sample) | 18.1% | 16.9% |
| Standard Deviation (Population) | 17.4% | 16.8% |
Similar Demographics by Single Father Poverty
Demographics Similar to Immigrants from England by Single Father Poverty
In terms of single father poverty, the demographic groups most similar to Immigrants from England are Immigrants from Scotland (16.7%, a difference of 0.0%), Cheyenne (16.7%, a difference of 0.030%), Immigrants from Uganda (16.7%, a difference of 0.13%), Spanish (16.7%, a difference of 0.14%), and Ghanaian (16.7%, a difference of 0.17%).
| Demographics | Rating | Rank | Single Father Poverty |
| Europeans | 13.2 /100 | #209 | Poor 16.6% |
| Guatemalans | 12.9 /100 | #210 | Poor 16.6% |
| Arabs | 12.8 /100 | #211 | Poor 16.6% |
| Immigrants | Southern Europe | 11.2 /100 | #212 | Poor 16.7% |
| Ghanaians | 11.0 /100 | #213 | Poor 16.7% |
| Spanish | 10.7 /100 | #214 | Poor 16.7% |
| Immigrants | Scotland | 9.6 /100 | #215 | Tragic 16.7% |
| Immigrants | England | 9.5 /100 | #216 | Tragic 16.7% |
| Cheyenne | 9.3 /100 | #217 | Tragic 16.7% |
| Immigrants | Uganda | 8.6 /100 | #218 | Tragic 16.7% |
| Immigrants | Ghana | 8.1 /100 | #219 | Tragic 16.7% |
| Immigrants | Denmark | 8.1 /100 | #220 | Tragic 16.7% |
| Immigrants | Greece | 8.1 /100 | #221 | Tragic 16.7% |
| Immigrants | Spain | 8.0 /100 | #222 | Tragic 16.7% |
| Immigrants | Austria | 7.0 /100 | #223 | Tragic 16.8% |
Demographics Similar to Samoans by Single Father Poverty
In terms of single father poverty, the demographic groups most similar to Samoans are Immigrants from Taiwan (13.7%, a difference of 0.86%), Afghan (14.0%, a difference of 1.1%), Korean (14.0%, a difference of 1.2%), Filipino (14.0%, a difference of 1.6%), and Immigrants from India (14.0%, a difference of 1.6%).
| Demographics | Rating | Rank | Single Father Poverty |
| Assyrians/Chaldeans/Syriacs | 100.0 /100 | #1 | Exceptional 11.7% |
| Tongans | 100.0 /100 | #2 | Exceptional 12.2% |
| Tsimshian | 100.0 /100 | #3 | Exceptional 12.7% |
| Immigrants | Fiji | 100.0 /100 | #4 | Exceptional 13.2% |
| Immigrants | Ethiopia | 100.0 /100 | #5 | Exceptional 13.4% |
| Ethiopians | 100.0 /100 | #6 | Exceptional 13.5% |
| Immigrants | Taiwan | 100.0 /100 | #7 | Exceptional 13.7% |
| Samoans | 100.0 /100 | #8 | Exceptional 13.8% |
| Afghans | 100.0 /100 | #9 | Exceptional 14.0% |
| Koreans | 100.0 /100 | #10 | Exceptional 14.0% |
| Filipinos | 100.0 /100 | #11 | Exceptional 14.0% |
| Immigrants | India | 100.0 /100 | #12 | Exceptional 14.0% |
| Immigrants | Philippines | 100.0 /100 | #13 | Exceptional 14.0% |
| Immigrants | Vietnam | 100.0 /100 | #14 | Exceptional 14.1% |
| Sri Lankans | 100.0 /100 | #15 | Exceptional 14.2% |