Immigrants from England vs Kiowa Single Father Poverty
COMPARE
Immigrants from England
Kiowa
Single Father Poverty
Single Father Poverty Comparison
Immigrants from England
Kiowa
16.7%
SINGLE FATHER POVERTY
9.5/ 100
METRIC RATING
216th/ 347
METRIC RANK
22.5%
SINGLE FATHER POVERTY
0.0/ 100
METRIC RATING
334th/ 347
METRIC RANK
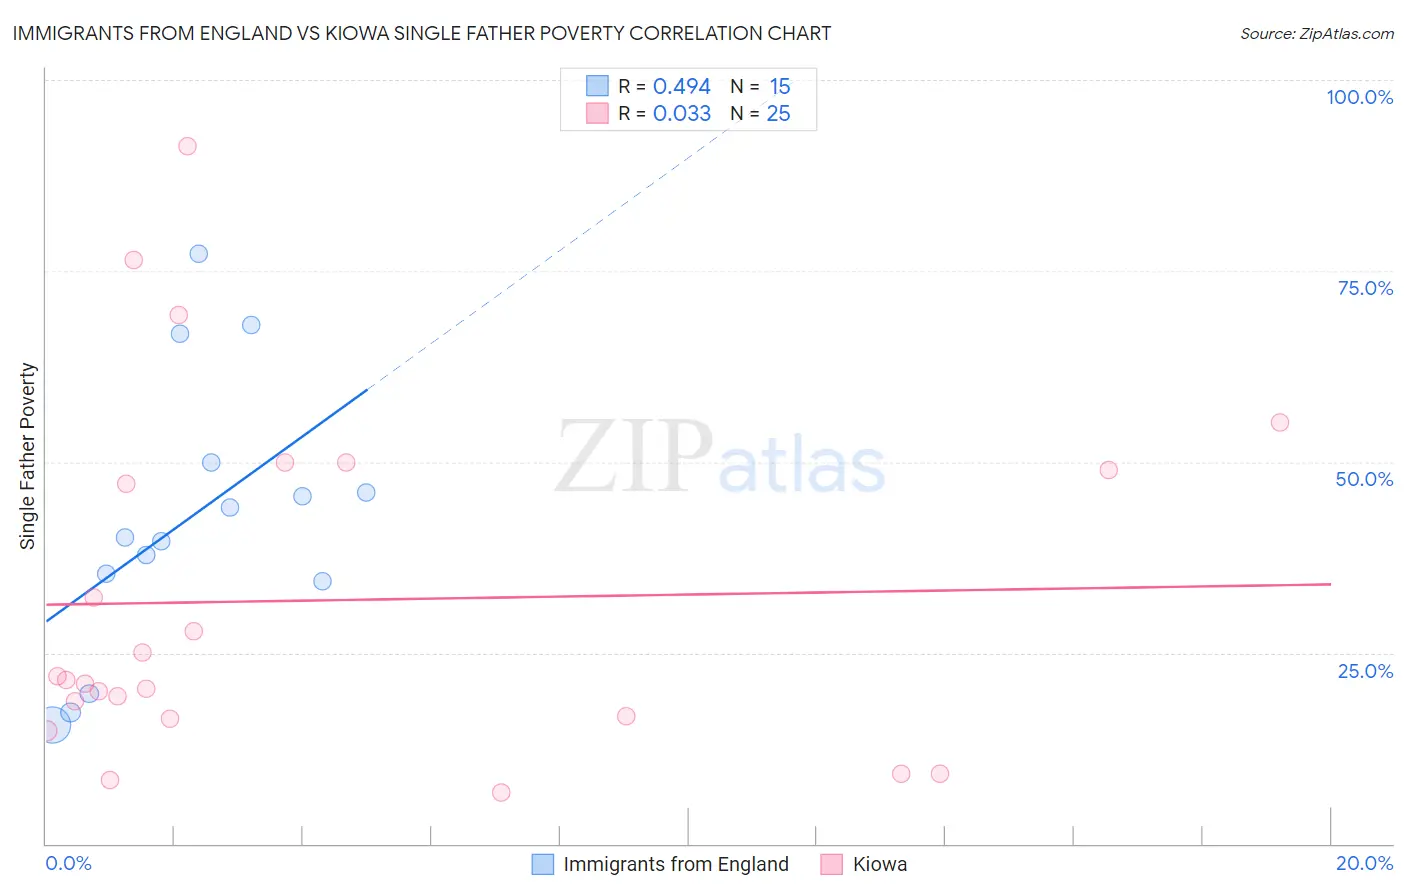
Immigrants from England vs Kiowa Single Father Poverty Correlation Chart
The statistical analysis conducted on geographies consisting of 303,741,945 people shows a moderate positive correlation between the proportion of Immigrants from England and poverty level among single fathers in the United States with a correlation coefficient (R) of 0.494 and weighted average of 16.7%. Similarly, the statistical analysis conducted on geographies consisting of 53,338,998 people shows no correlation between the proportion of Kiowa and poverty level among single fathers in the United States with a correlation coefficient (R) of 0.033 and weighted average of 22.5%, a difference of 34.6%.
Single Father Poverty Correlation Summary
| Measurement | Immigrants from England | Kiowa |
| Minimum | 15.5% | 6.7% |
| Maximum | 77.3% | 91.3% |
| Range | 61.8% | 84.6% |
| Mean | 42.5% | 31.9% |
| Median | 40.2% | 21.5% |
| Interquartile 25% (IQ1) | 34.4% | 16.5% |
| Interquartile 75% (IQ3) | 49.9% | 49.5% |
| Interquartile Range (IQR) | 15.5% | 33.0% |
| Standard Deviation (Sample) | 18.1% | 22.9% |
| Standard Deviation (Population) | 17.4% | 22.5% |
Similar Demographics by Single Father Poverty
Demographics Similar to Immigrants from England by Single Father Poverty
In terms of single father poverty, the demographic groups most similar to Immigrants from England are Immigrants from Scotland (16.7%, a difference of 0.0%), Cheyenne (16.7%, a difference of 0.030%), Immigrants from Uganda (16.7%, a difference of 0.13%), Spanish (16.7%, a difference of 0.14%), and Ghanaian (16.7%, a difference of 0.17%).
| Demographics | Rating | Rank | Single Father Poverty |
| Europeans | 13.2 /100 | #209 | Poor 16.6% |
| Guatemalans | 12.9 /100 | #210 | Poor 16.6% |
| Arabs | 12.8 /100 | #211 | Poor 16.6% |
| Immigrants | Southern Europe | 11.2 /100 | #212 | Poor 16.7% |
| Ghanaians | 11.0 /100 | #213 | Poor 16.7% |
| Spanish | 10.7 /100 | #214 | Poor 16.7% |
| Immigrants | Scotland | 9.6 /100 | #215 | Tragic 16.7% |
| Immigrants | England | 9.5 /100 | #216 | Tragic 16.7% |
| Cheyenne | 9.3 /100 | #217 | Tragic 16.7% |
| Immigrants | Uganda | 8.6 /100 | #218 | Tragic 16.7% |
| Immigrants | Ghana | 8.1 /100 | #219 | Tragic 16.7% |
| Immigrants | Denmark | 8.1 /100 | #220 | Tragic 16.7% |
| Immigrants | Greece | 8.1 /100 | #221 | Tragic 16.7% |
| Immigrants | Spain | 8.0 /100 | #222 | Tragic 16.7% |
| Immigrants | Austria | 7.0 /100 | #223 | Tragic 16.8% |
Demographics Similar to Kiowa by Single Father Poverty
In terms of single father poverty, the demographic groups most similar to Kiowa are Native/Alaskan (22.4%, a difference of 0.36%), Shoshone (22.9%, a difference of 2.0%), Tohono O'odham (22.0%, a difference of 2.1%), Cajun (23.1%, a difference of 2.7%), and Central American Indian (21.7%, a difference of 3.6%).
| Demographics | Rating | Rank | Single Father Poverty |
| Choctaw | 0.0 /100 | #327 | Tragic 20.7% |
| Pueblo | 0.0 /100 | #328 | Tragic 21.1% |
| Colville | 0.0 /100 | #329 | Tragic 21.4% |
| Paiute | 0.0 /100 | #330 | Tragic 21.6% |
| Central American Indians | 0.0 /100 | #331 | Tragic 21.7% |
| Tohono O'odham | 0.0 /100 | #332 | Tragic 22.0% |
| Natives/Alaskans | 0.0 /100 | #333 | Tragic 22.4% |
| Kiowa | 0.0 /100 | #334 | Tragic 22.5% |
| Shoshone | 0.0 /100 | #335 | Tragic 22.9% |
| Cajuns | 0.0 /100 | #336 | Tragic 23.1% |
| Sioux | 0.0 /100 | #337 | Tragic 23.9% |
| Arapaho | 0.0 /100 | #338 | Tragic 24.0% |
| Apache | 0.0 /100 | #339 | Tragic 24.2% |
| Houma | 0.0 /100 | #340 | Tragic 26.7% |
| Hopi | 0.0 /100 | #341 | Tragic 27.2% |