Immigrants from England vs Colombian Family Poverty
COMPARE
Immigrants from England
Colombian
Family Poverty
Family Poverty Comparison
Immigrants from England
Colombians
8.0%
FAMILY POVERTY
97.1/ 100
METRIC RATING
90th/ 347
METRIC RANK
9.2%
FAMILY POVERTY
36.1/ 100
METRIC RATING
186th/ 347
METRIC RANK
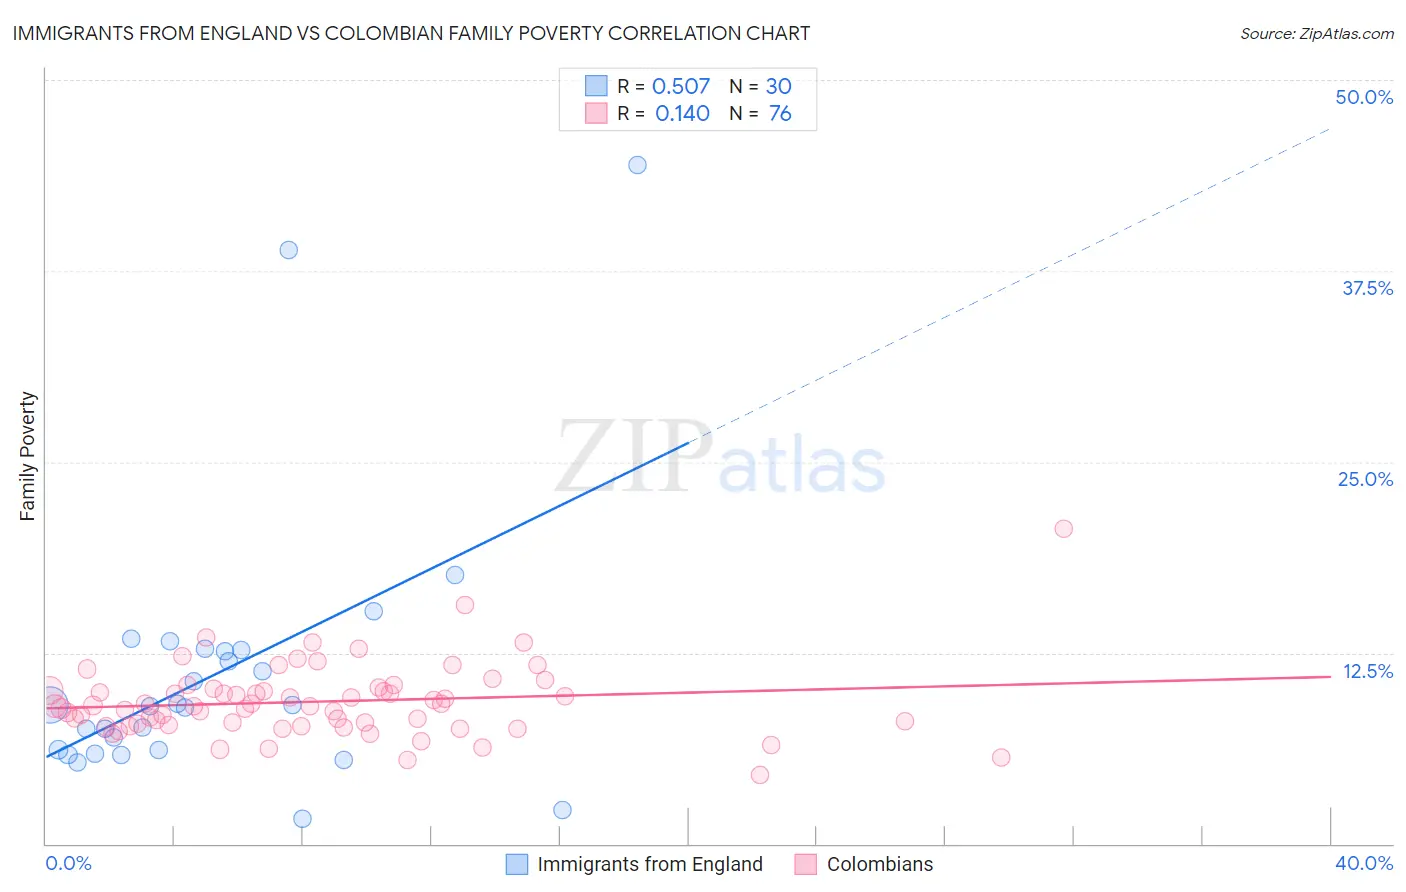
Immigrants from England vs Colombian Family Poverty Correlation Chart
The statistical analysis conducted on geographies consisting of 390,846,172 people shows a substantial positive correlation between the proportion of Immigrants from England and poverty level among families in the United States with a correlation coefficient (R) of 0.507 and weighted average of 8.0%. Similarly, the statistical analysis conducted on geographies consisting of 418,403,011 people shows a poor positive correlation between the proportion of Colombians and poverty level among families in the United States with a correlation coefficient (R) of 0.140 and weighted average of 9.2%, a difference of 15.1%.
Family Poverty Correlation Summary
| Measurement | Immigrants from England | Colombian |
| Minimum | 1.6% | 4.5% |
| Maximum | 44.4% | 20.6% |
| Range | 42.8% | 16.1% |
| Mean | 11.1% | 9.3% |
| Median | 9.0% | 9.0% |
| Interquartile 25% (IQ1) | 6.1% | 7.8% |
| Interquartile 75% (IQ3) | 12.6% | 10.1% |
| Interquartile Range (IQR) | 6.5% | 2.3% |
| Standard Deviation (Sample) | 9.1% | 2.4% |
| Standard Deviation (Population) | 8.9% | 2.4% |
Similar Demographics by Family Poverty
Demographics Similar to Immigrants from England by Family Poverty
In terms of family poverty, the demographic groups most similar to Immigrants from England are Immigrants from Denmark (8.0%, a difference of 0.0%), Serbian (8.0%, a difference of 0.15%), Immigrants from Italy (8.0%, a difference of 0.16%), Belgian (8.0%, a difference of 0.21%), and Scottish (7.9%, a difference of 0.30%).
| Demographics | Rating | Rank | Family Poverty |
| Slovaks | 97.7 /100 | #83 | Exceptional 7.9% |
| British | 97.5 /100 | #84 | Exceptional 7.9% |
| Immigrants | Asia | 97.4 /100 | #85 | Exceptional 7.9% |
| Scottish | 97.3 /100 | #86 | Exceptional 7.9% |
| Belgians | 97.3 /100 | #87 | Exceptional 8.0% |
| Serbians | 97.2 /100 | #88 | Exceptional 8.0% |
| Immigrants | Denmark | 97.1 /100 | #89 | Exceptional 8.0% |
| Immigrants | England | 97.1 /100 | #90 | Exceptional 8.0% |
| Immigrants | Italy | 97.0 /100 | #91 | Exceptional 8.0% |
| Czechoslovakians | 96.8 /100 | #92 | Exceptional 8.0% |
| Tlingit-Haida | 96.7 /100 | #93 | Exceptional 8.0% |
| Immigrants | Pakistan | 96.6 /100 | #94 | Exceptional 8.0% |
| Immigrants | Philippines | 96.5 /100 | #95 | Exceptional 8.0% |
| Immigrants | Turkey | 96.5 /100 | #96 | Exceptional 8.0% |
| Immigrants | Switzerland | 96.1 /100 | #97 | Exceptional 8.1% |
Demographics Similar to Colombians by Family Poverty
In terms of family poverty, the demographic groups most similar to Colombians are Delaware (9.2%, a difference of 0.090%), Immigrants from Kenya (9.2%, a difference of 0.29%), Immigrants from Saudi Arabia (9.1%, a difference of 0.35%), South American Indian (9.1%, a difference of 0.36%), and Uruguayan (9.1%, a difference of 0.43%).
| Demographics | Rating | Rank | Family Poverty |
| Immigrants | Iraq | 44.4 /100 | #179 | Average 9.1% |
| Immigrants | Uganda | 43.4 /100 | #180 | Average 9.1% |
| Hmong | 40.2 /100 | #181 | Average 9.1% |
| Immigrants | Morocco | 40.2 /100 | #182 | Average 9.1% |
| Uruguayans | 39.2 /100 | #183 | Fair 9.1% |
| South American Indians | 38.7 /100 | #184 | Fair 9.1% |
| Immigrants | Saudi Arabia | 38.6 /100 | #185 | Fair 9.1% |
| Colombians | 36.1 /100 | #186 | Fair 9.2% |
| Delaware | 35.4 /100 | #187 | Fair 9.2% |
| Immigrants | Kenya | 34.0 /100 | #188 | Fair 9.2% |
| Immigrants | Afghanistan | 32.1 /100 | #189 | Fair 9.2% |
| Arabs | 31.5 /100 | #190 | Fair 9.2% |
| Ugandans | 28.7 /100 | #191 | Fair 9.3% |
| Spanish | 28.7 /100 | #192 | Fair 9.3% |
| Immigrants | Western Asia | 28.2 /100 | #193 | Fair 9.3% |