Immigrants from El Salvador vs Pima Male Poverty
COMPARE
Immigrants from El Salvador
Pima
Male Poverty
Male Poverty Comparison
Immigrants from El Salvador
Pima
12.8%
MALE POVERTY
0.2/ 100
METRIC RATING
246th/ 347
METRIC RANK
20.4%
MALE POVERTY
0.0/ 100
METRIC RATING
342nd/ 347
METRIC RANK
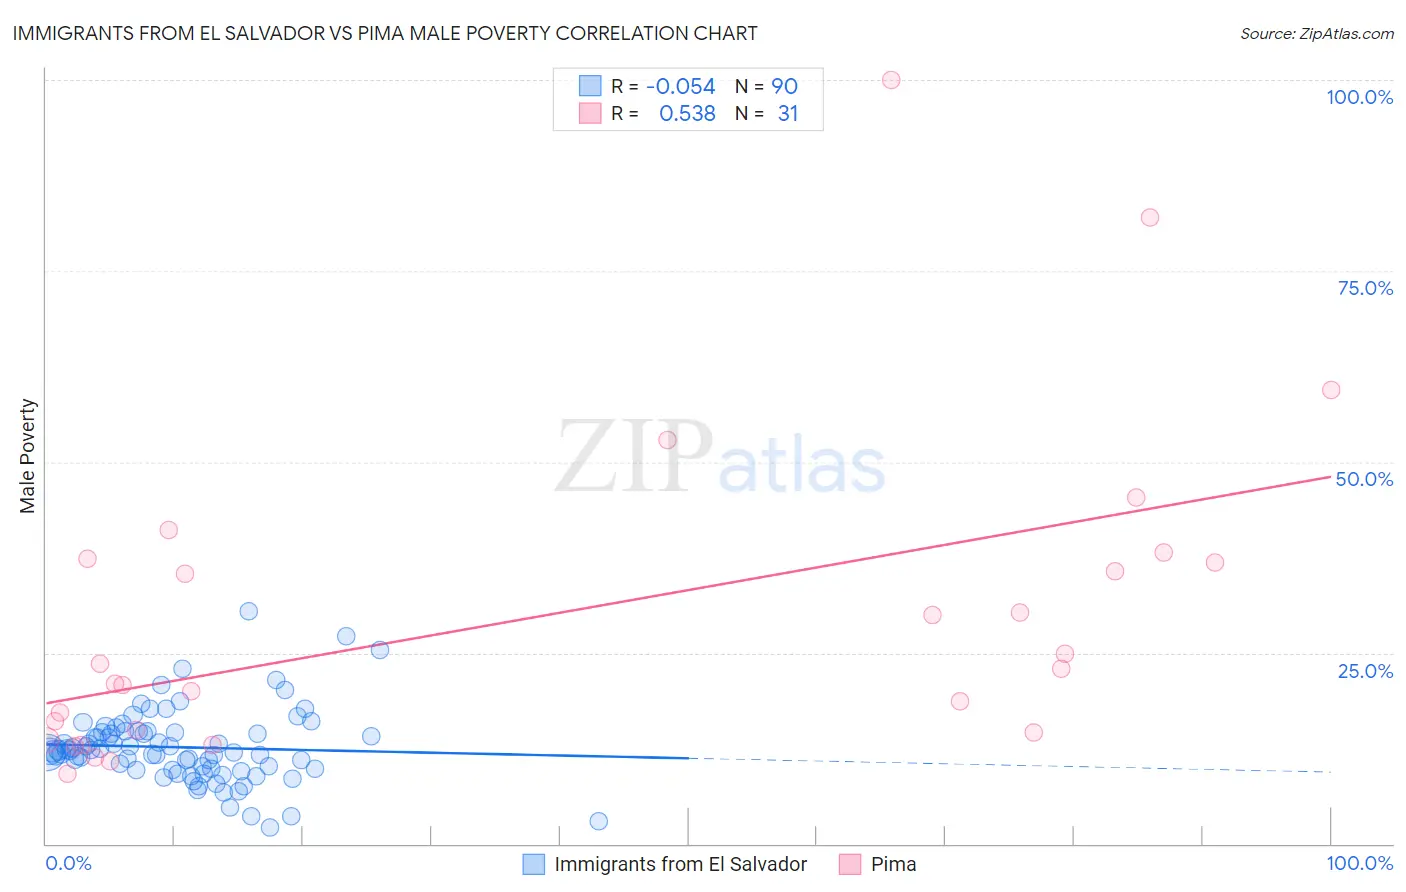
Immigrants from El Salvador vs Pima Male Poverty Correlation Chart
The statistical analysis conducted on geographies consisting of 357,646,043 people shows a slight negative correlation between the proportion of Immigrants from El Salvador and poverty level among males in the United States with a correlation coefficient (R) of -0.054 and weighted average of 12.8%. Similarly, the statistical analysis conducted on geographies consisting of 61,538,248 people shows a substantial positive correlation between the proportion of Pima and poverty level among males in the United States with a correlation coefficient (R) of 0.538 and weighted average of 20.4%, a difference of 58.6%.
Male Poverty Correlation Summary
| Measurement | Immigrants from El Salvador | Pima |
| Minimum | 2.2% | 9.2% |
| Maximum | 30.5% | 100.0% |
| Range | 28.3% | 90.8% |
| Mean | 12.6% | 29.7% |
| Median | 12.2% | 23.0% |
| Interquartile 25% (IQ1) | 9.8% | 14.5% |
| Interquartile 75% (IQ3) | 14.6% | 37.4% |
| Interquartile Range (IQR) | 4.8% | 22.9% |
| Standard Deviation (Sample) | 4.8% | 21.0% |
| Standard Deviation (Population) | 4.8% | 20.7% |
Similar Demographics by Male Poverty
Demographics Similar to Immigrants from El Salvador by Male Poverty
In terms of male poverty, the demographic groups most similar to Immigrants from El Salvador are Liberian (12.8%, a difference of 0.30%), Tsimshian (12.8%, a difference of 0.32%), Immigrants from Western Africa (12.9%, a difference of 0.35%), Immigrants from Sudan (12.9%, a difference of 0.41%), and Alaskan Athabascan (12.8%, a difference of 0.42%).
| Demographics | Rating | Rank | Male Poverty |
| Ghanaians | 0.4 /100 | #239 | Tragic 12.7% |
| Immigrants | Middle Africa | 0.4 /100 | #240 | Tragic 12.7% |
| Sudanese | 0.3 /100 | #241 | Tragic 12.8% |
| Nepalese | 0.3 /100 | #242 | Tragic 12.8% |
| Alaskan Athabascans | 0.3 /100 | #243 | Tragic 12.8% |
| Tsimshian | 0.3 /100 | #244 | Tragic 12.8% |
| Liberians | 0.3 /100 | #245 | Tragic 12.8% |
| Immigrants | El Salvador | 0.2 /100 | #246 | Tragic 12.8% |
| Immigrants | Western Africa | 0.2 /100 | #247 | Tragic 12.9% |
| Immigrants | Sudan | 0.2 /100 | #248 | Tragic 12.9% |
| Potawatomi | 0.2 /100 | #249 | Tragic 12.9% |
| Immigrants | Nicaragua | 0.2 /100 | #250 | Tragic 12.9% |
| Immigrants | Cuba | 0.2 /100 | #251 | Tragic 12.9% |
| Immigrants | Ecuador | 0.2 /100 | #252 | Tragic 12.9% |
| Immigrants | Ghana | 0.2 /100 | #253 | Tragic 12.9% |
Demographics Similar to Pima by Male Poverty
In terms of male poverty, the demographic groups most similar to Pima are Yup'ik (20.4%, a difference of 0.10%), Lumbee (20.2%, a difference of 0.78%), Immigrants from Yemen (20.1%, a difference of 1.1%), Hopi (20.8%, a difference of 2.2%), and Yuman (19.5%, a difference of 4.2%).
| Demographics | Rating | Rank | Male Poverty |
| Natives/Alaskans | 0.0 /100 | #333 | Tragic 16.9% |
| Cheyenne | 0.0 /100 | #334 | Tragic 17.6% |
| Apache | 0.0 /100 | #335 | Tragic 17.7% |
| Pueblo | 0.0 /100 | #336 | Tragic 18.5% |
| Sioux | 0.0 /100 | #337 | Tragic 18.7% |
| Crow | 0.0 /100 | #338 | Tragic 19.1% |
| Yuman | 0.0 /100 | #339 | Tragic 19.5% |
| Immigrants | Yemen | 0.0 /100 | #340 | Tragic 20.1% |
| Lumbee | 0.0 /100 | #341 | Tragic 20.2% |
| Pima | 0.0 /100 | #342 | Tragic 20.4% |
| Yup'ik | 0.0 /100 | #343 | Tragic 20.4% |
| Hopi | 0.0 /100 | #344 | Tragic 20.8% |
| Puerto Ricans | 0.0 /100 | #345 | Tragic 22.0% |
| Navajo | 0.0 /100 | #346 | Tragic 22.3% |
| Tohono O'odham | 0.0 /100 | #347 | Tragic 22.9% |