Immigrants from Egypt vs Immigrants from India Poverty
COMPARE
Immigrants from Egypt
Immigrants from India
Poverty
Poverty Comparison
Immigrants from Egypt
Immigrants from India
11.5%
POVERTY
94.6/ 100
METRIC RATING
97th/ 347
METRIC RANK
9.0%
POVERTY
100.0/ 100
METRIC RATING
1st/ 347
METRIC RANK
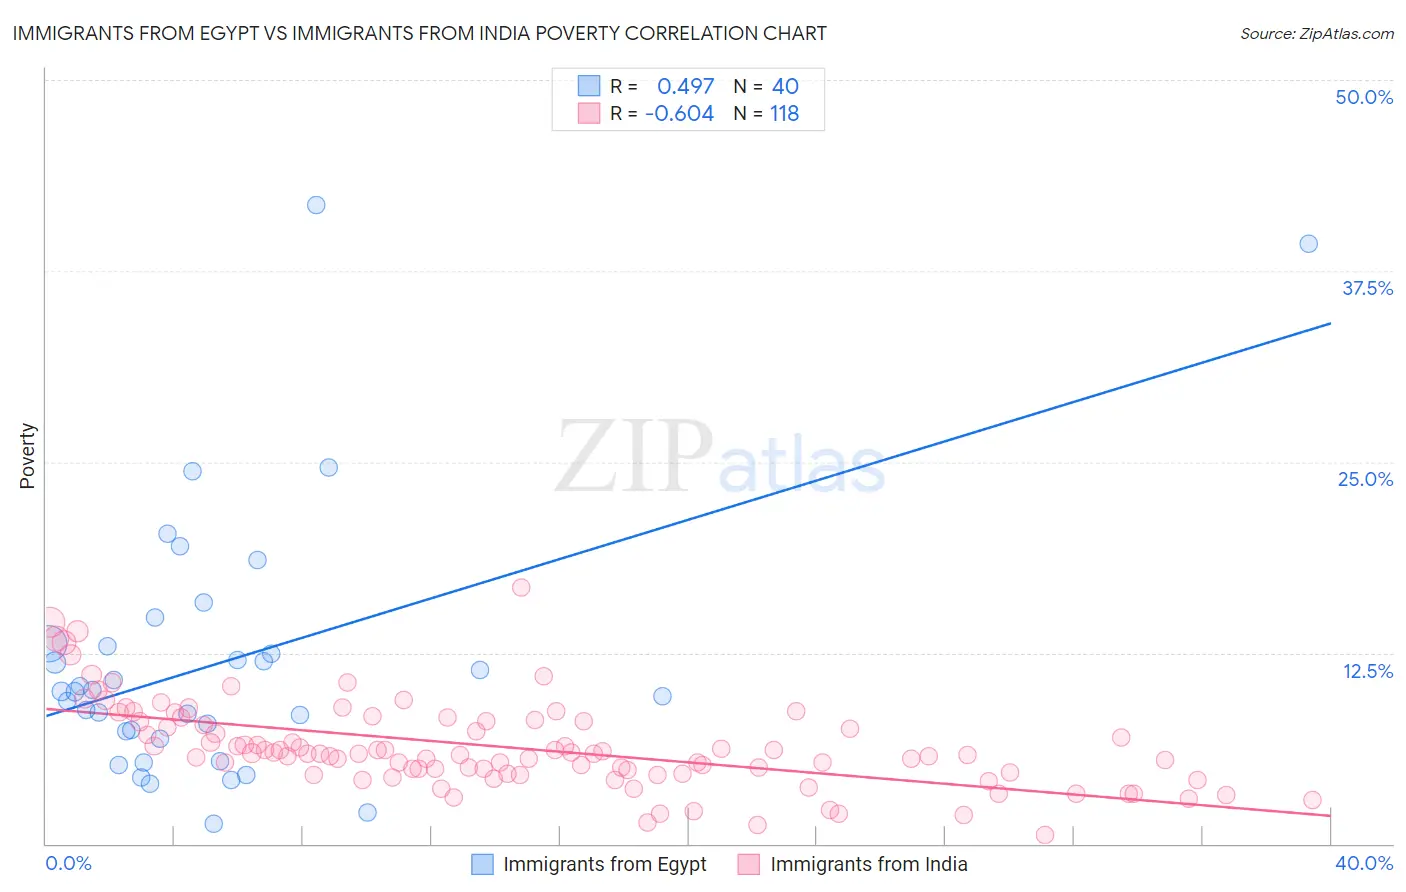
Immigrants from Egypt vs Immigrants from India Poverty Correlation Chart
The statistical analysis conducted on geographies consisting of 245,409,377 people shows a moderate positive correlation between the proportion of Immigrants from Egypt and poverty level in the United States with a correlation coefficient (R) of 0.497 and weighted average of 11.5%. Similarly, the statistical analysis conducted on geographies consisting of 433,739,641 people shows a significant negative correlation between the proportion of Immigrants from India and poverty level in the United States with a correlation coefficient (R) of -0.604 and weighted average of 9.0%, a difference of 26.9%.
Poverty Correlation Summary
| Measurement | Immigrants from Egypt | Immigrants from India |
| Minimum | 1.3% | 0.59% |
| Maximum | 41.8% | 16.8% |
| Range | 40.5% | 16.2% |
| Mean | 11.9% | 6.3% |
| Median | 9.9% | 5.9% |
| Interquartile 25% (IQ1) | 7.1% | 4.6% |
| Interquartile 75% (IQ3) | 13.0% | 8.0% |
| Interquartile Range (IQR) | 5.9% | 3.4% |
| Standard Deviation (Sample) | 8.6% | 2.8% |
| Standard Deviation (Population) | 8.5% | 2.8% |
Similar Demographics by Poverty
Demographics Similar to Immigrants from Egypt by Poverty
In terms of poverty, the demographic groups most similar to Immigrants from Egypt are Immigrants from South Africa (11.5%, a difference of 0.030%), Immigrants from Latvia (11.5%, a difference of 0.030%), Australian (11.4%, a difference of 0.15%), Paraguayan (11.4%, a difference of 0.16%), and Immigrants from Indonesia (11.5%, a difference of 0.17%).
| Demographics | Rating | Rank | Poverty |
| Immigrants | Denmark | 95.5 /100 | #90 | Exceptional 11.4% |
| Finns | 95.2 /100 | #91 | Exceptional 11.4% |
| British | 95.0 /100 | #92 | Exceptional 11.4% |
| Romanians | 94.9 /100 | #93 | Exceptional 11.4% |
| Paraguayans | 94.9 /100 | #94 | Exceptional 11.4% |
| Australians | 94.9 /100 | #95 | Exceptional 11.4% |
| Immigrants | South Africa | 94.7 /100 | #96 | Exceptional 11.5% |
| Immigrants | Egypt | 94.6 /100 | #97 | Exceptional 11.5% |
| Immigrants | Latvia | 94.5 /100 | #98 | Exceptional 11.5% |
| Immigrants | Indonesia | 94.2 /100 | #99 | Exceptional 11.5% |
| Scottish | 94.0 /100 | #100 | Exceptional 11.5% |
| Slavs | 93.3 /100 | #101 | Exceptional 11.5% |
| Laotians | 92.4 /100 | #102 | Exceptional 11.6% |
| Okinawans | 92.4 /100 | #103 | Exceptional 11.6% |
| Native Hawaiians | 92.1 /100 | #104 | Exceptional 11.6% |
Demographics Similar to Immigrants from India by Poverty
In terms of poverty, the demographic groups most similar to Immigrants from India are Chinese (9.5%, a difference of 5.6%), Thai (9.6%, a difference of 6.1%), Immigrants from Taiwan (9.7%, a difference of 7.6%), Immigrants from Ireland (10.1%, a difference of 11.6%), and Assyrian/Chaldean/Syriac (10.1%, a difference of 11.8%).
| Demographics | Rating | Rank | Poverty |
| Immigrants | India | 100.0 /100 | #1 | Exceptional 9.0% |
| Chinese | 100.0 /100 | #2 | Exceptional 9.5% |
| Thais | 100.0 /100 | #3 | Exceptional 9.6% |
| Immigrants | Taiwan | 100.0 /100 | #4 | Exceptional 9.7% |
| Immigrants | Ireland | 99.9 /100 | #5 | Exceptional 10.1% |
| Assyrians/Chaldeans/Syriacs | 99.9 /100 | #6 | Exceptional 10.1% |
| Filipinos | 99.9 /100 | #7 | Exceptional 10.1% |
| Maltese | 99.9 /100 | #8 | Exceptional 10.2% |
| Immigrants | South Central Asia | 99.9 /100 | #9 | Exceptional 10.2% |
| Bulgarians | 99.9 /100 | #10 | Exceptional 10.2% |
| Immigrants | Lithuania | 99.9 /100 | #11 | Exceptional 10.3% |
| Bhutanese | 99.8 /100 | #12 | Exceptional 10.4% |
| Immigrants | Hong Kong | 99.8 /100 | #13 | Exceptional 10.4% |
| Immigrants | Bolivia | 99.8 /100 | #14 | Exceptional 10.4% |
| Bolivians | 99.8 /100 | #15 | Exceptional 10.4% |