Immigrants from Egypt vs Crow Poverty
COMPARE
Immigrants from Egypt
Crow
Poverty
Poverty Comparison
Immigrants from Egypt
Crow
11.5%
POVERTY
94.6/ 100
METRIC RATING
97th/ 347
METRIC RANK
20.7%
POVERTY
0.0/ 100
METRIC RATING
339th/ 347
METRIC RANK
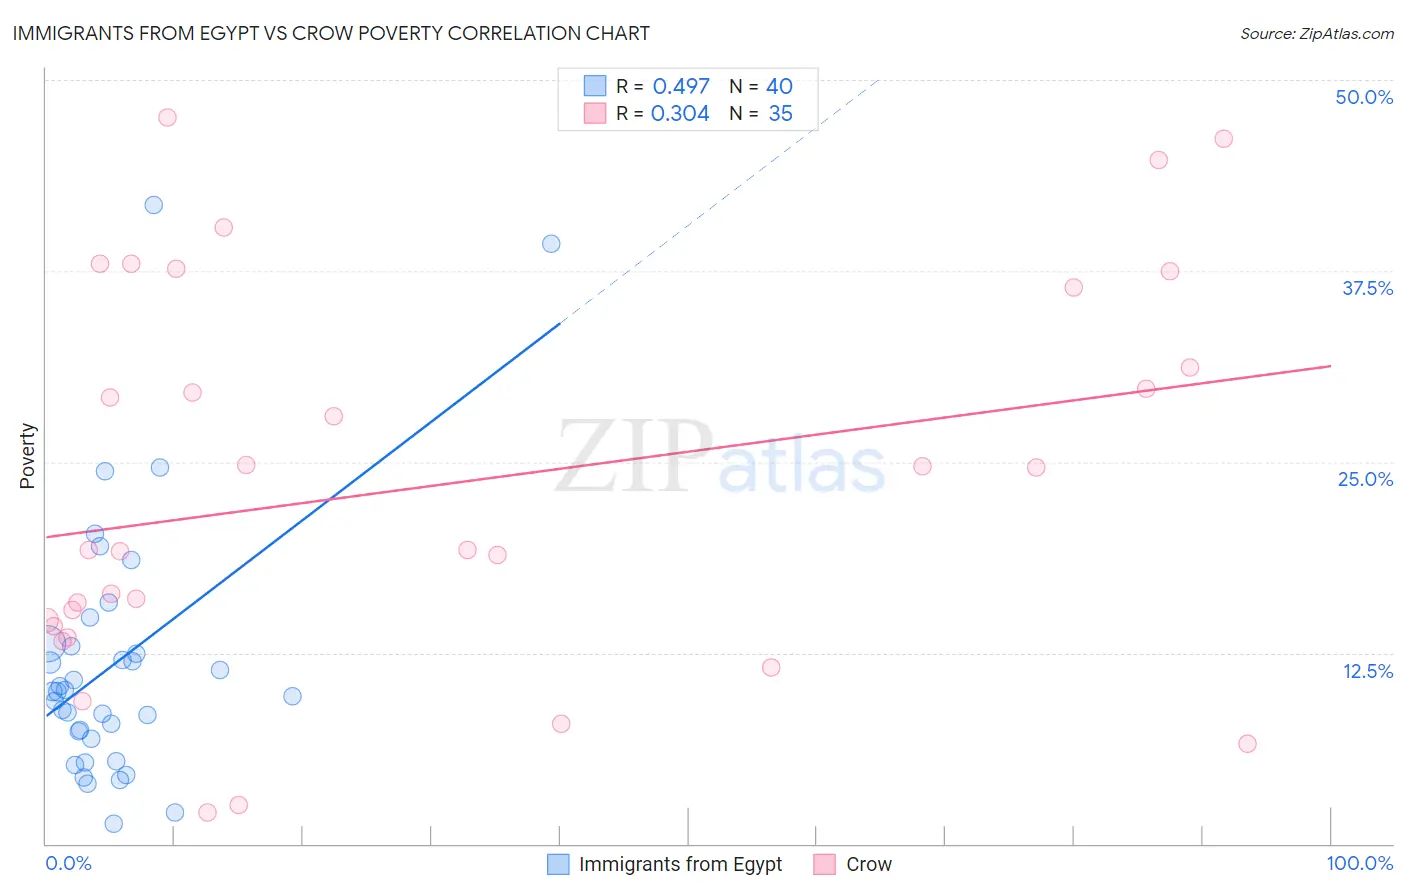
Immigrants from Egypt vs Crow Poverty Correlation Chart
The statistical analysis conducted on geographies consisting of 245,409,377 people shows a moderate positive correlation between the proportion of Immigrants from Egypt and poverty level in the United States with a correlation coefficient (R) of 0.497 and weighted average of 11.5%. Similarly, the statistical analysis conducted on geographies consisting of 59,200,262 people shows a mild positive correlation between the proportion of Crow and poverty level in the United States with a correlation coefficient (R) of 0.304 and weighted average of 20.7%, a difference of 80.2%.
Poverty Correlation Summary
| Measurement | Immigrants from Egypt | Crow |
| Minimum | 1.3% | 2.1% |
| Maximum | 41.8% | 47.5% |
| Range | 40.5% | 45.4% |
| Mean | 11.9% | 23.5% |
| Median | 9.9% | 19.2% |
| Interquartile 25% (IQ1) | 7.1% | 14.3% |
| Interquartile 75% (IQ3) | 13.0% | 36.4% |
| Interquartile Range (IQR) | 5.9% | 22.1% |
| Standard Deviation (Sample) | 8.6% | 12.7% |
| Standard Deviation (Population) | 8.5% | 12.5% |
Similar Demographics by Poverty
Demographics Similar to Immigrants from Egypt by Poverty
In terms of poverty, the demographic groups most similar to Immigrants from Egypt are Immigrants from South Africa (11.5%, a difference of 0.030%), Immigrants from Latvia (11.5%, a difference of 0.030%), Australian (11.4%, a difference of 0.15%), Paraguayan (11.4%, a difference of 0.16%), and Immigrants from Indonesia (11.5%, a difference of 0.17%).
| Demographics | Rating | Rank | Poverty |
| Immigrants | Denmark | 95.5 /100 | #90 | Exceptional 11.4% |
| Finns | 95.2 /100 | #91 | Exceptional 11.4% |
| British | 95.0 /100 | #92 | Exceptional 11.4% |
| Romanians | 94.9 /100 | #93 | Exceptional 11.4% |
| Paraguayans | 94.9 /100 | #94 | Exceptional 11.4% |
| Australians | 94.9 /100 | #95 | Exceptional 11.4% |
| Immigrants | South Africa | 94.7 /100 | #96 | Exceptional 11.5% |
| Immigrants | Egypt | 94.6 /100 | #97 | Exceptional 11.5% |
| Immigrants | Latvia | 94.5 /100 | #98 | Exceptional 11.5% |
| Immigrants | Indonesia | 94.2 /100 | #99 | Exceptional 11.5% |
| Scottish | 94.0 /100 | #100 | Exceptional 11.5% |
| Slavs | 93.3 /100 | #101 | Exceptional 11.5% |
| Laotians | 92.4 /100 | #102 | Exceptional 11.6% |
| Okinawans | 92.4 /100 | #103 | Exceptional 11.6% |
| Native Hawaiians | 92.1 /100 | #104 | Exceptional 11.6% |
Demographics Similar to Crow by Poverty
In terms of poverty, the demographic groups most similar to Crow are Yup'ik (20.8%, a difference of 0.75%), Hopi (20.8%, a difference of 0.93%), Yuman (20.2%, a difference of 2.2%), Immigrants from Yemen (21.5%, a difference of 4.1%), and Sioux (19.8%, a difference of 4.5%).
| Demographics | Rating | Rank | Poverty |
| Natives/Alaskans | 0.0 /100 | #332 | Tragic 18.1% |
| Houma | 0.0 /100 | #333 | Tragic 18.4% |
| Apache | 0.0 /100 | #334 | Tragic 18.4% |
| Cheyenne | 0.0 /100 | #335 | Tragic 18.9% |
| Pueblo | 0.0 /100 | #336 | Tragic 19.4% |
| Sioux | 0.0 /100 | #337 | Tragic 19.8% |
| Yuman | 0.0 /100 | #338 | Tragic 20.2% |
| Crow | 0.0 /100 | #339 | Tragic 20.7% |
| Yup'ik | 0.0 /100 | #340 | Tragic 20.8% |
| Hopi | 0.0 /100 | #341 | Tragic 20.8% |
| Immigrants | Yemen | 0.0 /100 | #342 | Tragic 21.5% |
| Pima | 0.0 /100 | #343 | Tragic 21.9% |
| Lumbee | 0.0 /100 | #344 | Tragic 21.9% |
| Navajo | 0.0 /100 | #345 | Tragic 23.1% |
| Puerto Ricans | 0.0 /100 | #346 | Tragic 23.7% |