Immigrants from Ecuador vs Immigrants from South America Receiving Food Stamps
COMPARE
Immigrants from Ecuador
Immigrants from South America
Receiving Food Stamps
Receiving Food Stamps Comparison
Immigrants from Ecuador
Immigrants from South America
15.0%
RECEIVING FOOD STAMPS
0.0/ 100
METRIC RATING
284th/ 347
METRIC RANK
12.8%
RECEIVING FOOD STAMPS
6.5/ 100
METRIC RATING
216th/ 347
METRIC RANK
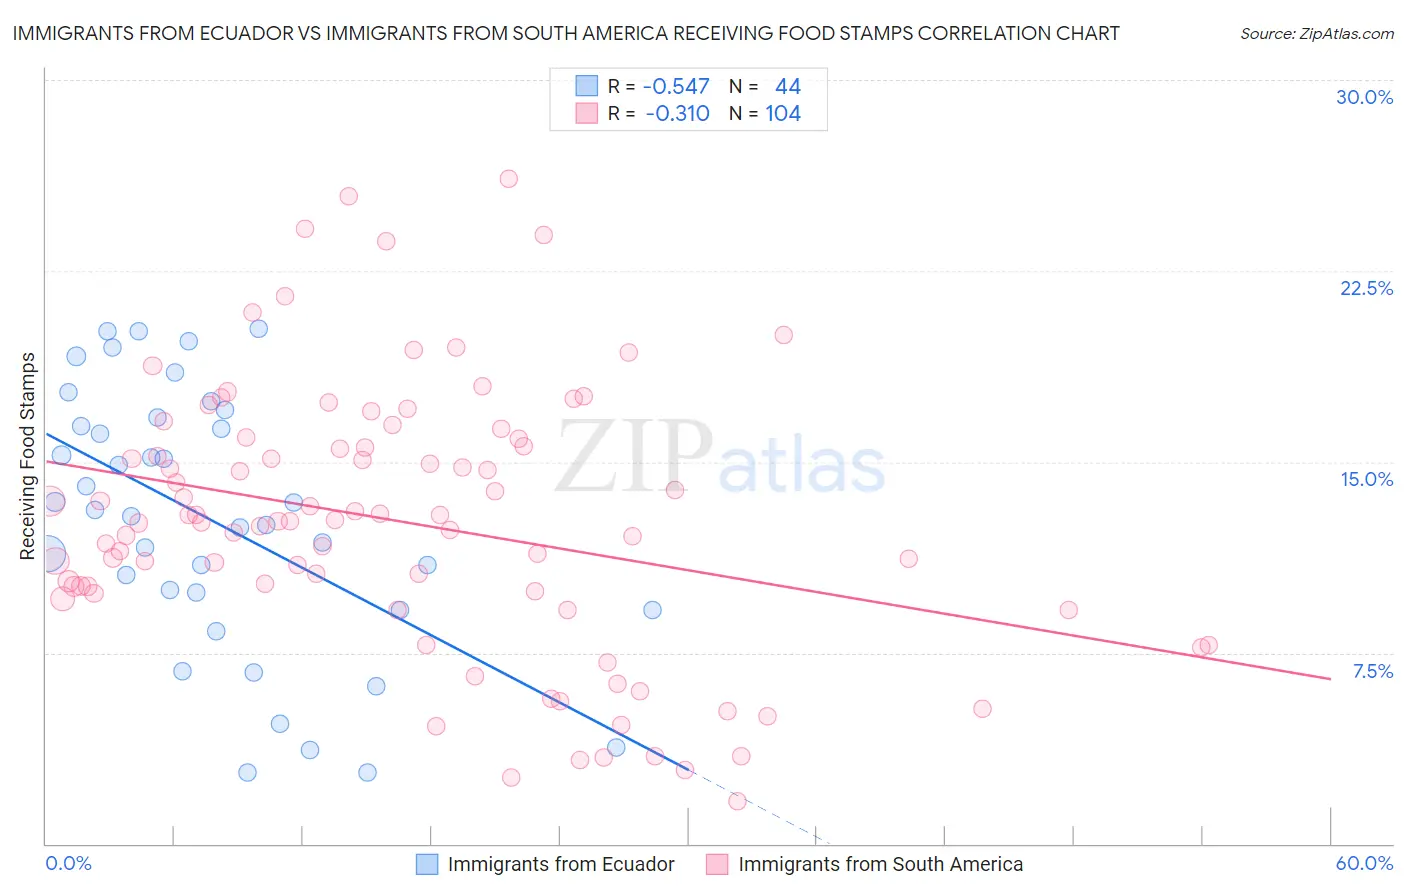
Immigrants from Ecuador vs Immigrants from South America Receiving Food Stamps Correlation Chart
The statistical analysis conducted on geographies consisting of 270,373,002 people shows a substantial negative correlation between the proportion of Immigrants from Ecuador and percentage of population receiving government assistance and/or food stamps in the United States with a correlation coefficient (R) of -0.547 and weighted average of 15.0%. Similarly, the statistical analysis conducted on geographies consisting of 484,382,726 people shows a mild negative correlation between the proportion of Immigrants from South America and percentage of population receiving government assistance and/or food stamps in the United States with a correlation coefficient (R) of -0.310 and weighted average of 12.8%, a difference of 17.2%.
Receiving Food Stamps Correlation Summary
| Measurement | Immigrants from Ecuador | Immigrants from South America |
| Minimum | 2.8% | 1.7% |
| Maximum | 20.2% | 26.1% |
| Range | 17.4% | 24.5% |
| Mean | 12.7% | 12.6% |
| Median | 13.0% | 12.6% |
| Interquartile 25% (IQ1) | 9.5% | 9.9% |
| Interquartile 75% (IQ3) | 16.6% | 15.8% |
| Interquartile Range (IQR) | 7.0% | 5.9% |
| Standard Deviation (Sample) | 5.0% | 5.3% |
| Standard Deviation (Population) | 5.0% | 5.2% |
Similar Demographics by Receiving Food Stamps
Demographics Similar to Immigrants from Ecuador by Receiving Food Stamps
In terms of receiving food stamps, the demographic groups most similar to Immigrants from Ecuador are Bangladeshi (15.0%, a difference of 0.010%), Immigrants from Central America (15.0%, a difference of 0.29%), Immigrants from Liberia (15.1%, a difference of 0.38%), African (15.1%, a difference of 0.52%), and Immigrants from Mexico (15.2%, a difference of 0.75%).
| Demographics | Rating | Rank | Receiving Food Stamps |
| Seminole | 0.1 /100 | #277 | Tragic 14.8% |
| Belizeans | 0.1 /100 | #278 | Tragic 14.8% |
| Kiowa | 0.0 /100 | #279 | Tragic 14.9% |
| Ecuadorians | 0.0 /100 | #280 | Tragic 14.9% |
| Spanish American Indians | 0.0 /100 | #281 | Tragic 14.9% |
| Immigrants | Central America | 0.0 /100 | #282 | Tragic 15.0% |
| Bangladeshis | 0.0 /100 | #283 | Tragic 15.0% |
| Immigrants | Ecuador | 0.0 /100 | #284 | Tragic 15.0% |
| Immigrants | Liberia | 0.0 /100 | #285 | Tragic 15.1% |
| Africans | 0.0 /100 | #286 | Tragic 15.1% |
| Immigrants | Mexico | 0.0 /100 | #287 | Tragic 15.2% |
| Immigrants | Belize | 0.0 /100 | #288 | Tragic 15.2% |
| Immigrants | Senegal | 0.0 /100 | #289 | Tragic 15.3% |
| Senegalese | 0.0 /100 | #290 | Tragic 15.4% |
| Hondurans | 0.0 /100 | #291 | Tragic 15.5% |
Demographics Similar to Immigrants from South America by Receiving Food Stamps
In terms of receiving food stamps, the demographic groups most similar to Immigrants from South America are Native Hawaiian (12.8%, a difference of 0.11%), Immigrants from Burma/Myanmar (12.9%, a difference of 0.26%), Immigrants from Africa (12.8%, a difference of 0.55%), Moroccan (12.8%, a difference of 0.58%), and Hawaiian (12.9%, a difference of 0.63%).
| Demographics | Rating | Rank | Receiving Food Stamps |
| Immigrants | Sierra Leone | 12.9 /100 | #209 | Poor 12.5% |
| Immigrants | Uruguay | 12.8 /100 | #210 | Poor 12.5% |
| Colombians | 10.2 /100 | #211 | Poor 12.6% |
| Malaysians | 8.5 /100 | #212 | Tragic 12.7% |
| Moroccans | 7.6 /100 | #213 | Tragic 12.8% |
| Immigrants | Africa | 7.6 /100 | #214 | Tragic 12.8% |
| Native Hawaiians | 6.7 /100 | #215 | Tragic 12.8% |
| Immigrants | South America | 6.5 /100 | #216 | Tragic 12.8% |
| Immigrants | Burma/Myanmar | 6.0 /100 | #217 | Tragic 12.9% |
| Hawaiians | 5.4 /100 | #218 | Tragic 12.9% |
| Immigrants | Middle Africa | 5.4 /100 | #219 | Tragic 12.9% |
| Immigrants | Colombia | 5.3 /100 | #220 | Tragic 12.9% |
| Bermudans | 4.8 /100 | #221 | Tragic 13.0% |
| Immigrants | Immigrants | 4.4 /100 | #222 | Tragic 13.0% |
| Immigrants | Albania | 4.4 /100 | #223 | Tragic 13.0% |